How to Graph Phase Shifts of Trigonometric Functions (Precalculus - Trigonometry 16)
TLDRThe video script offers an in-depth exploration of phase shifting in trigonometric functions, focusing on horizontal shifts along the x-axis. The presenter emphasizes the importance of having a coefficient of x equal to one for identifying phase shifts and periods accurately. The process involves several steps: looking for vertical shifts, identifying phase shifts, calculating periods, and using key points to graph the functions. The video uses examples with sine and cosine functions, illustrating how to adjust for phase shifts and periods, and how to alter key points based on these transformations. The script also clarifies the distinction between even and odd functions, particularly noting sine as an odd function, which allows for changing the sign of the input to get the opposite output. The presenter provides a method to quickly graph these functions by considering phase shifts, periods, and the behavior of the sine and cosine functions at key points, ultimately offering a comprehensive guide to understanding and graphing phase shifts in trigonometric functions.
Takeaways
- 📐 **Phase Shift Basics**: Phase shifting refers to a horizontal shift of trigonometric functions along the x-axis, which is conveniently located next to the x variable in the function's equation.
- ➕➖ **Shift Direction**: Adding next to x (input) shifts the graph to the left, while subtracting shifts it to the right, which is the opposite of what one might initially think.
- 🔍 **Coefficient of x**: To identify a phase shift, the coefficient of x must be one, which often requires dividing the entire function by that coefficient.
- 📈 **Graphing Order**: When graphing, first look for vertical shifts, then identify phase shifts, followed by periods, and finally use key points to complete the graph.
- 🔄 **Period Calculation**: After dividing by the coefficient and identifying phase shifts, the period of the function is found by dividing the original period of the trigonometric function by the new coefficient of x.
- 🔀 **Key Points Modification**: The key points of the trigonometric function, such as maxima, minima, and intercepts, are modified according to the phase shift and any vertical stretches or compressions.
- 🔃 **Odd and Even Functions**: Sine is an odd function, which means its sign changes with the sign of its input, allowing for manipulation of the function's sign without altering its output.
- 🔗 **Function Transformation**: The process of graphing a transformed trigonometric function involves identifying vertical and horizontal shifts, phase shifts, periods, and then plotting key points based on the function's characteristics.
- 🧮 **Graphing Steps**: The steps for graphing a phase-shifted trigonometric function include identifying shifts, finding the new period, plotting the center and quarters of the period, and marking key points.
- 🔳 **Continuing the Cycle**: Once the first cycle of a phase-shifted trigonometric function is graphed, additional cycles can be drawn by continuing to add the period to the phase shift.
- 📋 **Proper Form**: It is crucial to have the trigonometric function in proper form, with a coefficient of one for x, to accurately identify phase shifts, periods, and to graph the function correctly.
Q & A
What is a phase shift in the context of trigonometric functions?
-A phase shift refers to a horizontal shift of a trigonometric function along the x-axis. It changes the location of the function on the graph without affecting its overall shape.
How does the sign of the coefficient next to the x variable in a trigonometric function affect the direction of the phase shift?
-The sign of the coefficient next to the x variable determines the direction of the phase shift. If there is a plus sign, the shift is to the left, and if there is a minus sign, the shift is to the right.
Why is it necessary to have a coefficient of 1 next to the x variable when identifying a phase shift?
-Having a coefficient of 1 next to the x variable is important because it allows for the correct identification of both the period and the phase shift of the trigonometric function.
What is the proper form for a trigonometric function when graphing?
-The proper form for a trigonometric function when graphing includes having the coefficient of x as 1, any constants added or subtracted at the end, and the function itself in a way that allows for easy identification of vertical and horizontal shifts.
How does the period of a trigonometric function change when the coefficient of x is not 1?
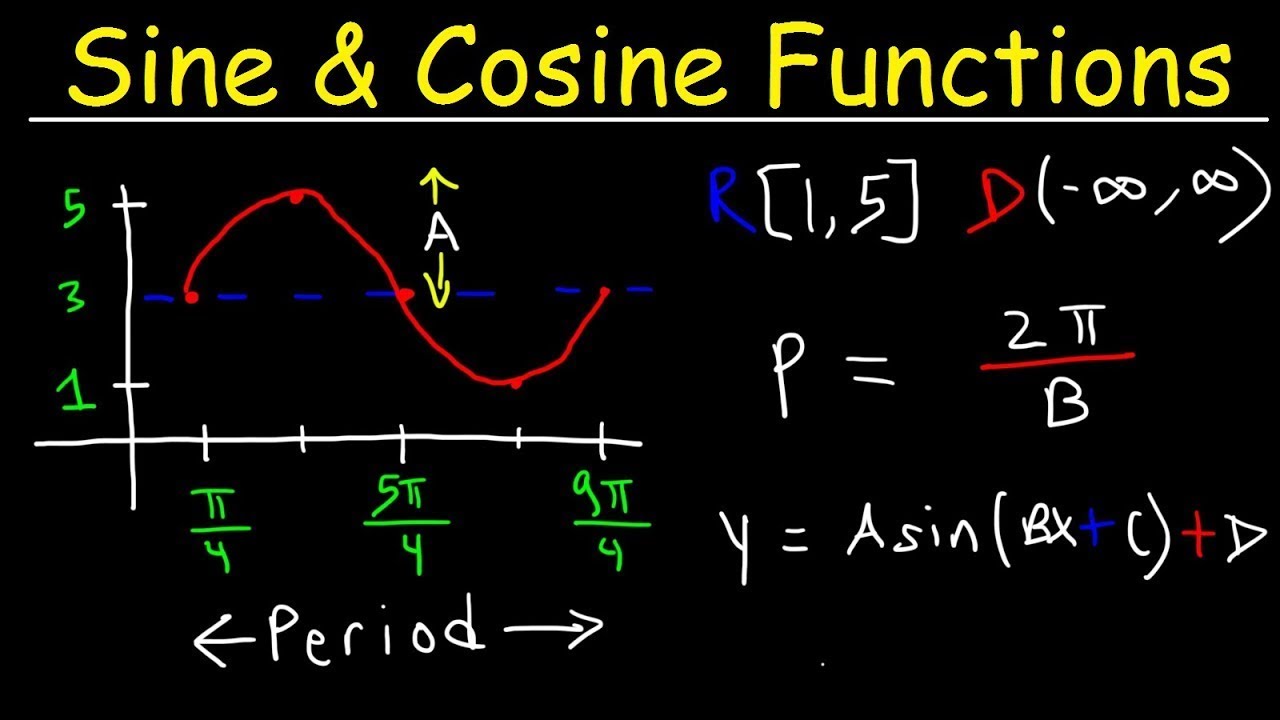
-When the coefficient of x is not 1, the period of the trigonometric function changes. The new period is the original period (typically 2π for sine and cosine functions) divided by the absolute value of the coefficient of x.
What are the steps to graph a trigonometric function with a phase shift?
-The steps to graph a trigonometric function with a phase shift are: 1) Look for a vertical shift, 2) Identify the phase shift and ensure the coefficient of x is 1, 3) Determine the new period based on the coefficient of x, 4) Use key points to graph the function, and 5) Apply any additional transformations such as vertical stretch or compression.
How can you find the end of the first period of a phase-shifted trigonometric function?
-To find the end of the first period of a phase-shifted trigonometric function, add the phase shift value to the period of the function after the phase shift has been applied.
What is the significance of the quadrants and key points in graphing a phase-shifted sine or cosine function?
-The quadrants and key points are significant because they help determine the location of the peaks, valleys, and x-intercepts of the phase-shifted trigonometric function. These points are crucial for constructing the graph accurately.
How does the odd or even nature of a trigonometric function affect its graph when there is a negative coefficient?
-For odd functions like sine, a negative coefficient results in a reflection across the origin, which can be handled by changing the sign in front of the function. For even functions like cosine, a negative coefficient does not affect the graph because opposite inputs for even functions yield the same output.
Why is it important to factor out the coefficient of x when the coefficient is not 1?
-Factoring out the coefficient of x when it is not 1 is important because it simplifies the function to a form where the coefficient of x is 1, which is necessary for accurately identifying the period and phase shift of the function.
What is the effect of a vertical stretch on the key points of a trigonometric function?
-A vertical stretch affects the key points of a trigonometric function by multiplying the y-values of the key points by the factor of the stretch. This changes the amplitude of the function without affecting its period or phase shift.
Outlines
😀 Introduction to Phase Shifting Trigonometric Functions
The video begins with an introduction to phase shifting, which is a type of horizontal shift of trigonometric functions. The presenter explains that the shift is applied along the x-axis and is indicated next to the x variable in the function's equation. The importance of having a coefficient of 1 for the x term when identifying phase shifts is emphasized. The process of graphing trig functions with phase shifts involves looking for vertical shifts, identifying phase shifts by ensuring the coefficient of x is 1, examining periods, and using key points to graph the function. An example using the sine function with a phase shift is provided to illustrate the steps.
📈 Graphing with Phase Shifts and Key Points
The paragraph demonstrates how to graph trigonometric functions with phase shifts by drawing on the graph and adjusting key points based on the phase shift. It discusses the lack of a vertical shift in the current example and focuses on the phase shift to the right by π/2. The period of the sine function is calculated by dividing the standard period (2π) by the coefficient of x, which has been adjusted to 1. The concept of adding the phase shift to the period to determine the endpoints of the first period is introduced. Key points for the sine function are identified, including x-intercepts and local maxima/minima, and the effects of any vertical stretch or shrink are considered.
🔍 Correct Form for Trigonometric Function Transformations
The presenter stresses the importance of having the trigonometric function in the proper form before graphing, with a coefficient of 1 for the x term to identify the period and phase shift. An example using the cosine function with a vertical shift and phase shift is given. The process of factoring out the coefficient of x and adjusting the phase shift accordingly is shown. The video explains how to identify multiple transformations such as vertical shift, phase shift, horizontal compression, and vertical stretch. The steps for graphing are outlined, emphasizing the order in which transformations should be applied.
📐 Graphing Techniques for Cosine Functions
This section delves into the specifics of graphing cosine functions with phase shifts and vertical shifts. The process involves identifying the starting point of the graph based on the phase shift and then determining the period of the function. The period of the cosine function is found by dividing the standard period (2π) by the coefficient of x. The video illustrates how to find the center and quarters of the period, which are crucial for plotting key points. The cosine function's key points, which include the ends of the period and the center, are identified and used to graph the function. The concept of x-intercepts at the quarters is discussed in relation to the shifted graph.
🤔 Understanding the Odd Function Property of Sine
The video explains the property of sine being an odd function and how it affects the graphing process. It clarifies that the negative sign in front of the sine function can be managed by changing the sign in front of the entire function due to sine's odd nature. The presenter demonstrates how to identify the phase shift and period for a sine function and adjust the key points accordingly. The process of averaging the start and end of the period to find the center and quarters is shown. The importance of understanding the underlying function's behavior, such as sine's x-intercepts, is emphasized.
📉 Dealing with Cosine Functions and Their Shifts
The paragraph discusses the handling of cosine functions, which are even functions, and their shifts. The video explains that cosine functions do not require a change in sign like sine functions do because cosine's even nature means that the function's output remains the same for both positive and negative inputs. The presenter shows how to identify vertical and horizontal shifts for a cosine function and how to find the period by adjusting for the coefficient of x. The process of graphing the cosine function by finding the phase shift, period, and key points is demonstrated, highlighting the cosine function's x-intercepts at the quarters of the period.
🎓 Final Thoughts on Phase Shifting and Graphing
The video concludes with a summary of the process for phase shifting and graphing trigonometric functions. It emphasizes the importance of understanding the order of operations and the mathematical concepts behind phase shifts. The presenter provides a quick method for graphing functions by using the period to find key points without explicitly plotting each one. The video ends with a teaser for the next topic, which will involve discussing inverses, and a farewell message.
Mindmap
Keywords
💡Phase Shift
💡Trigonometric Functions
💡Horizontal Shift
💡Coefficient of x
💡Period
💡Graphing
💡Key Points
💡Vertical Shift
💡Odd and Even Functions
💡Sine and Cosine
💡Graphing Steps
Highlights
The video discusses the concept of phase shifting in trigonometric functions, specifically focusing on horizontal shifts.
Phase shifting is represented as a shift along the x-axis and is conveniently located next to the x variable in the function.
The sign of the shift is opposite to the direction of the shift; adding to x shifts to the left, while subtracting shifts to the right.
To identify a phase shift, the coefficient of x must be one, which often requires dividing the function.
The process of graphing a phase shift involves looking for vertical shifts, identifying phase shifts, examining periods, and using key points.
The video provides a step-by-step example of graphing the function 3 sine of 2x minus pi, emphasizing the importance of proper form.
For the function 3 sine of 2x minus pi, the phase shift is a horizontal shift to the right by pi/2.
The period of a phase-shifted function is calculated by dividing the original period by the coefficient of x after the shift.
Key points for sine functions are identified at the ends, center, and quarters of the period, which are then adjusted based on the phase shift.
The video demonstrates how to alter key points for a sine function after a phase shift and a vertical stretch.
The concept of odd and even functions is introduced to explain how to handle negative coefficients in trigonometric functions.
The video shows how to graph the function 4 cosine of 4x plus 3, including handling a phase shift to the left and a vertical shift.
For cosine functions, key points are identified at the ends and center of the period, which are then adjusted for any phase or vertical shifts.
The process of graphing is shown for the function y equals negative 3 sine of negative 2x plus pi/2, emphasizing the role of odd functions in phase shifting.
The video concludes with a quick method for graphing cosine functions by identifying phase shifts, periods, and key points without explicitly plotting each point.
The importance of understanding the form of trigonometric functions before identifying shifts and periods is emphasized throughout the video.
The video provides a comprehensive guide to graphing phase-shifted trigonometric functions, making complex concepts more accessible.
Transcripts
Browse More Related Video
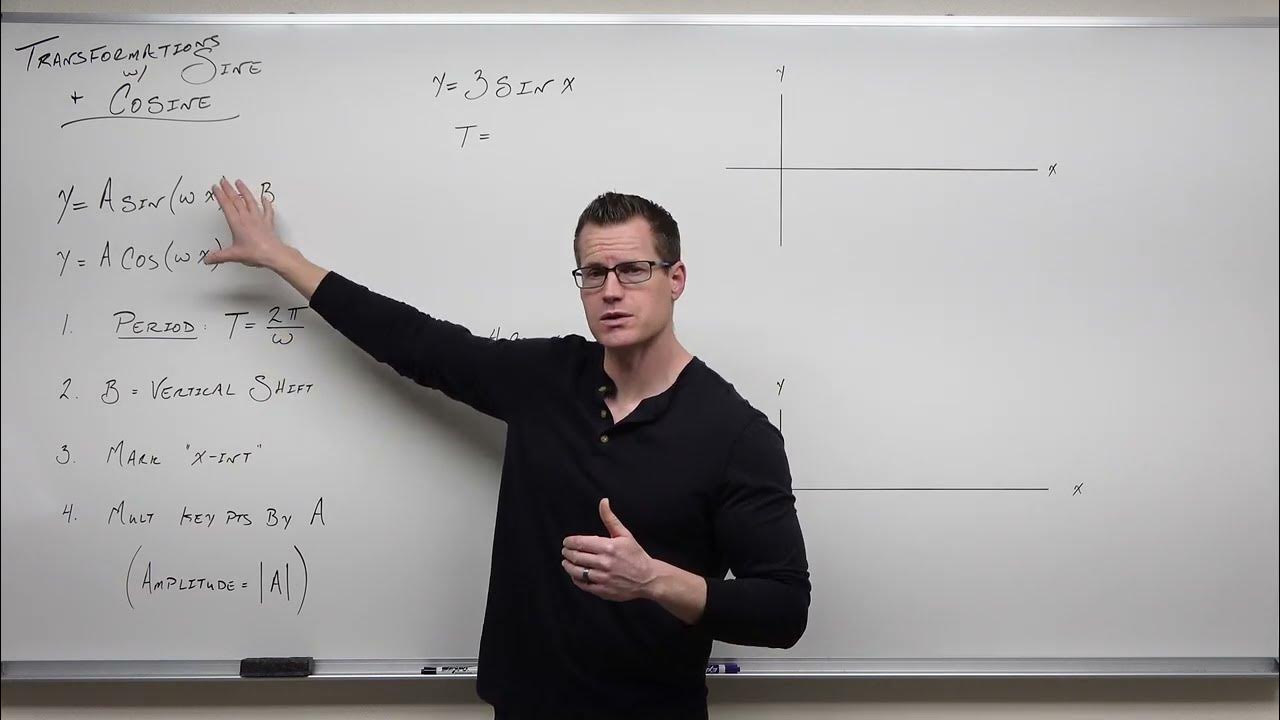
Graphing Transformations with Sine and Cosine (Precalculus - Trigonometry 12)
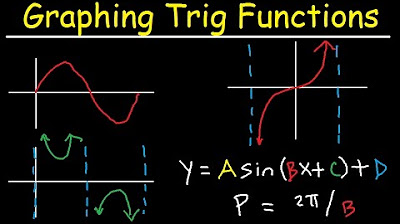
Graphing Trigonometric Functions, Phase Shift, Period, Transformations, Tangent, Cosecant, Cosine
How To Graph Trigonometric Functions | Trigonometry

How do you determine the phase shifts for sine and cosine graphs

Graphing Transformations with Tangent and Cotangent (Precalculus - Trigonometry 14)
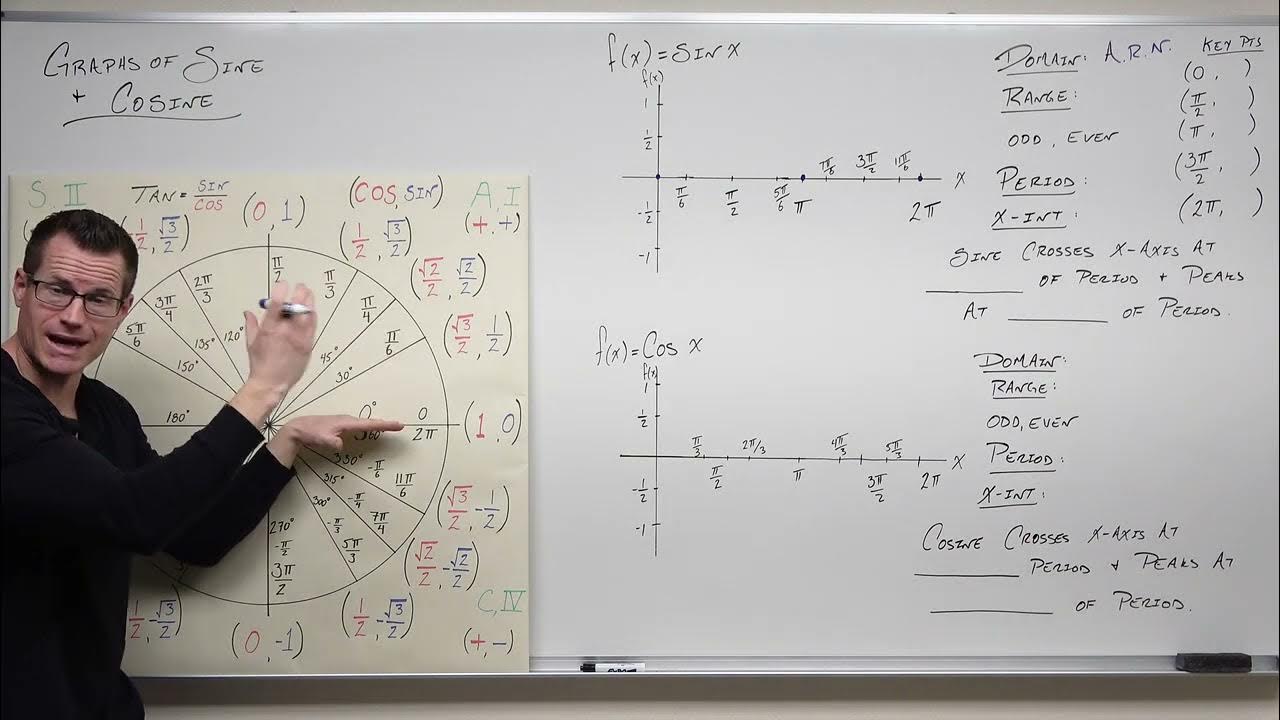
The Graphs of Sine and Cosine (Precalculus - Trigonometry 11)
5.0 / 5 (0 votes)
Thanks for rating: