Graphing Sine and Cosine Trig Functions With Transformations, Phase Shifts, Period - Domain & Range
TLDRThis video tutorial provides a comprehensive guide on graphing sine and cosine functions, focusing on the impact of horizontal phase shifts. It begins with basic equations like y=sin(x) and y=cos(x), explaining amplitude, period, and how to plot them. The video then progresses to more complex functions, detailing how to handle amplitude changes, vertical and horizontal shifts, and period adjustments. Examples are provided to illustrate the process of graphing functions with different parameters, such as y=2sin(x), y=3cos(1/3x), and y=-2sin(1/3x)+3, among others. The tutorial concludes by emphasizing the domain and range considerations for these trigonometric functions.
Takeaways
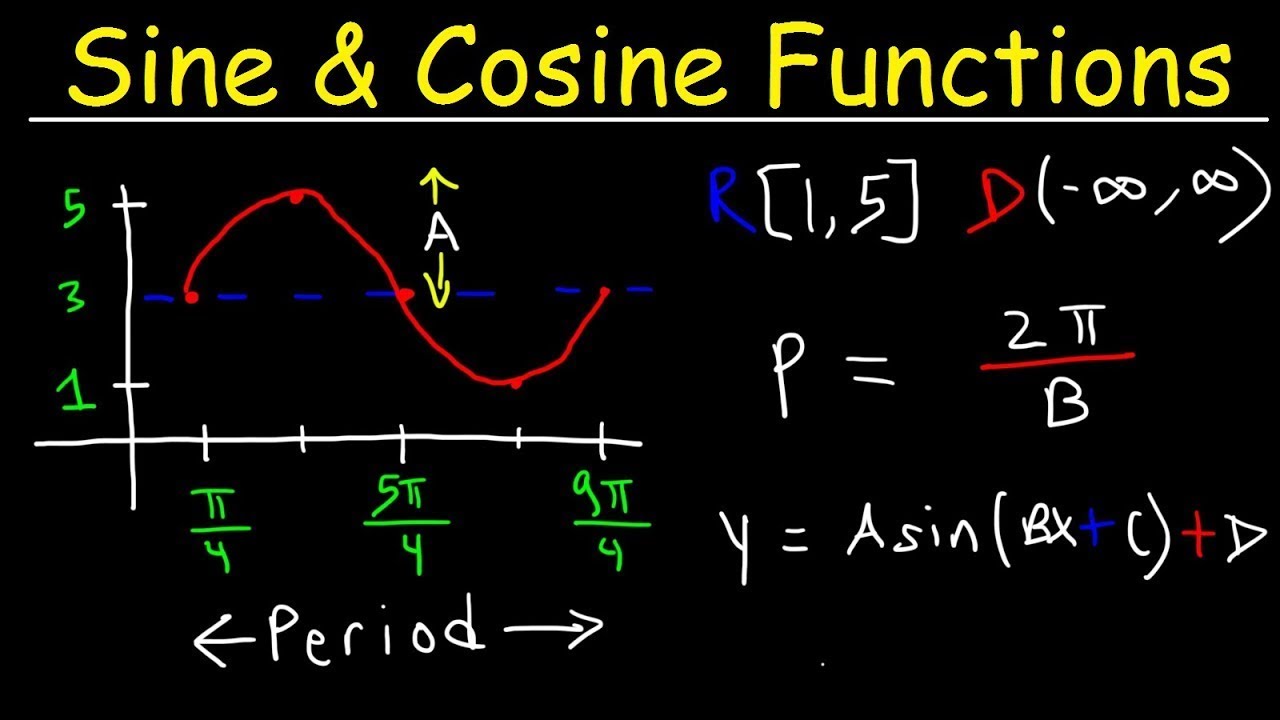
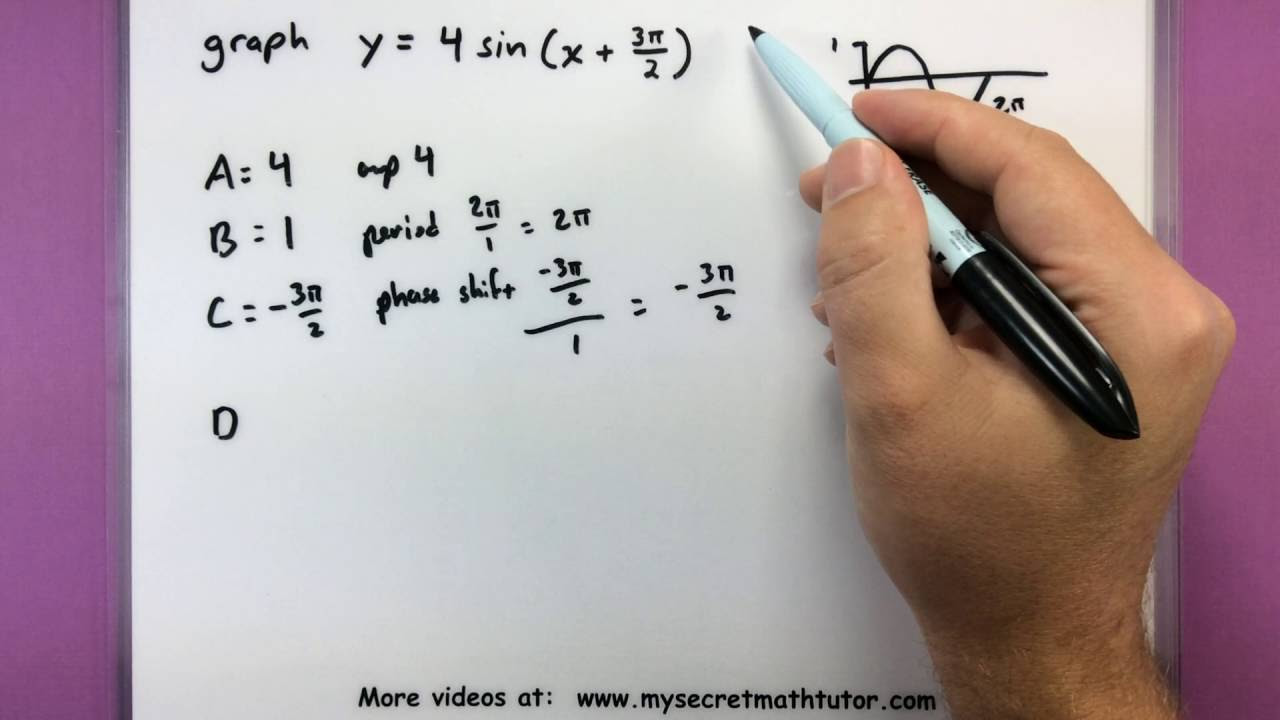
- 📈 The basic equation for sine and cosine functions is y = a * sin(Bx + C) + D, where 'a' is the amplitude, 'B' affects the period, 'C' indicates horizontal shifts, and 'D' is the vertical shift.
- 🌟 The amplitude ('a') determines the range of the function between its maximum and minimum values, typically between 1 and -1 for the basic sine and cosine functions.
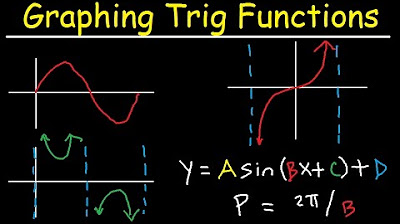
- 🔄 The period of a sine or cosine function is given by 2π/B, where 'B' is the coefficient of 'x'. The period represents the length of one complete cycle of the function.
- 📉 For the basic sine function (y = sin(x)), the period is 2π, and it starts at the center, goes up, down, and returns to the center, repeating this pattern.
- 📊 Negative sine (y = -sin(x)) inverts the function, so it goes down first instead of up, and the graph is a reflection across the x-axis.
- 📈 The cosine function (y = cos(x)) starts at the top, goes down, up, and returns to the center, with a period of 2π like the sine function.
- 🔄 When graphing y = 2sin(x), the vertical stretch is applied, doubling the amplitude to 2 and halving the period to π.
- 🔄 For y = 3cos(1/3x), the amplitude is 3, and there is a horizontal stretch by a factor of 3, with a period of 9π.
- 🔄 The vertical shift ('D') is added to or subtracted from the function's value to adjust the graph up or down.
- 🔄 The phase shift ('C') is calculated by setting the function equal to zero and solving for 'x'; this determines where the graph starts.
- 🔍 The domain for sine and cosine graphs is typically from negative infinity to infinity unless restricted, and the range varies depending on the amplitude and vertical shift.
Q & A
What is the basic equation for a sine function with amplitude and period?
-The basic equation for a sine function is y = sin(x), where the amplitude is 1 and the period is 2π.
How does the graph of y = -sin(x) differ from y = sin(x)?
-The graph of y = -sin(x) is a reflection of y = sin(x) across the x-axis, meaning it starts by going down instead of up.
What is the starting point of the cosine function graph?
-The starting point of the cosine function graph is at the top, unlike the sine function which starts at the center.
How does the equation y = 2sin(x) differ from y = sin(x) in terms of amplitude?
-The equation y = 2sin(x) has an amplitude of 2, meaning it varies between 2 and -2 instead of 1 and -1 as in y = sin(x).
What is the period of the function y = sin(2x)?
-The period of the function y = sin(2x) is π, which is half the period of y = sin(x).
What does the coefficient 'a' represent in the general equation for sine or cosine waves, y = a * sin(Bx + C) + D?
-In the general equation y = a * sin(Bx + C) + D, 'a' represents the amplitude of the function.
What does the coefficient 'B' in the general equation determine?
-The coefficient 'B' in the general equation determines the period of the function. The period is calculated as 2π/B.
What does the coefficient 'C' in the general equation indicate?
-The coefficient 'C' in the general equation indicates the presence of any horizontal phase shift.
What is the domain of sine and cosine functions when no restriction is applied?
-The domain of sine and cosine functions when no restriction is applied is from negative infinity to infinity.
How do you calculate the period of the function y = 3cos(1/3x)?
-The period of the function y = 3cos(1/3x) is calculated by dividing 2π by the coefficient of 'x', which is 1/3. So, the period is 2π / (1/3) = 6π.
What is the effect of a negative vertical shift on the graph of a sine or cosine function?
-A negative vertical shift moves the graph of a sine or cosine function downwards, changing the maximum value from the positive amplitude to the negative of the shift amount.
Outlines
📈 Basics of Graphing Sine and Cosine Functions
This paragraph introduces the fundamentals of graphing sine and cosine functions, focusing on the basic structures and equations. It starts with the simple equation y = sin(x) and explains the amplitude, period, and how the graph looks. The paragraph then contrasts this with the graph of y = cos(x), highlighting the differences in starting points and the shape of the graphs. The concept of amplitude and period modification is introduced with examples like y = 2sin(x) and y = sin(2x), explaining how they affect the graph.
📉 Negative Functions and Vertical Shifts
The second paragraph delves into the effects of negative signs and vertical shifts on sine and cosine functions. It explains how a negative sign inverts the graph and how vertical shifts affect the midline of the graph. The paragraph provides examples of graphing functions with vertical shifts, such as y = sin(x) + 2, and explains how to calculate the new amplitude and the resulting graph's appearance.
🌀 Phase Shifts and Period Adjustments
This paragraph discusses phase shifts and period adjustments in sine and cosine functions. It explains how to calculate the phase shift by setting the function equal to zero and solving for x. The paragraph also covers how to find the period of the function and uses examples like y = 2sin(4x) - 3 to illustrate the process. The explanation includes how to plot key points and extend the graph to cover one full cycle.
🔄 Domain and Range of Sine and Cosine Functions
The final paragraph addresses the domain and range of sine and cosine functions, emphasizing that these typically extend from negative infinity to infinity unless restricted. It provides an example of graphing y = -2sin(1/3x) - π/2 + 3, detailing how to find the phase shift, calculate the period, and plot the graph. The paragraph concludes by reiterating the importance of understanding amplitude, vertical shift, phase shift, and period when graphing sine and cosine functions.
Mindmap
Keywords
💡Amplitude
💡Period
💡Phase Shift
💡Vertical Shift
💡Sine Function
💡Cosine Function
💡Horizontal Stretch
💡Vertical Stretch
💡Domain
💡Range
💡Phase
Highlights
The video focuses on graphing sine and cosine functions, particularly with horizontal phase shifts.
The basic equation y = sin(x) is introduced with an amplitude of 1 and a period of 2π.
Negative sine function (-sin(x)) is explained, showing it goes down first instead of up.
Cosine function (cos(x)) is differentiated from sine, starting at the top and varying between 1 and -1.
The generic equation for sine or cosine wave is given as y = a * sin(Bx + C) + D, where a is amplitude, B affects period, C is horizontal phase shift, and D is vertical shift.
The effect of a vertical stretch in the sine function (e.g., sin(2x)) is explained, doubling the graph in the Y direction.
Horizontal stretching is demonstrated with the example of sin(1/2x), which stretches the graph by a factor of 2.
The concept of vertical shift is illustrated with the function y = sin(x) + 2, showing how to adjust the center line.
An example of combining vertical shift and amplitude is given with y = 3sin(x) + 4, highlighting the process of plotting the midline and range.
The process of graphing a function with a phase shift is detailed, using y = 2sin(4x) - 3 as an example.
The method for calculating the period of a function is explained, using 2π/B for the formula.
The video demonstrates how to find the phase shift by setting the function equal to zero and solving for x.
The range and domain of sine and cosine graphs are discussed, noting that they typically extend from negative infinity to infinity.
A comprehensive example is provided for graphing y = 3cos(1/2x) + π - 5, including vertical shift, amplitude, phase shift, and period calculation.
The video concludes by summarizing the process for graphing sine and cosine functions with amplitude, vertical shift, phase shift, and how to find all parameters from the equation.
Transcripts
Browse More Related Video

Graphing Transformations with Sine and Cosine (Precalculus - Trigonometry 12)
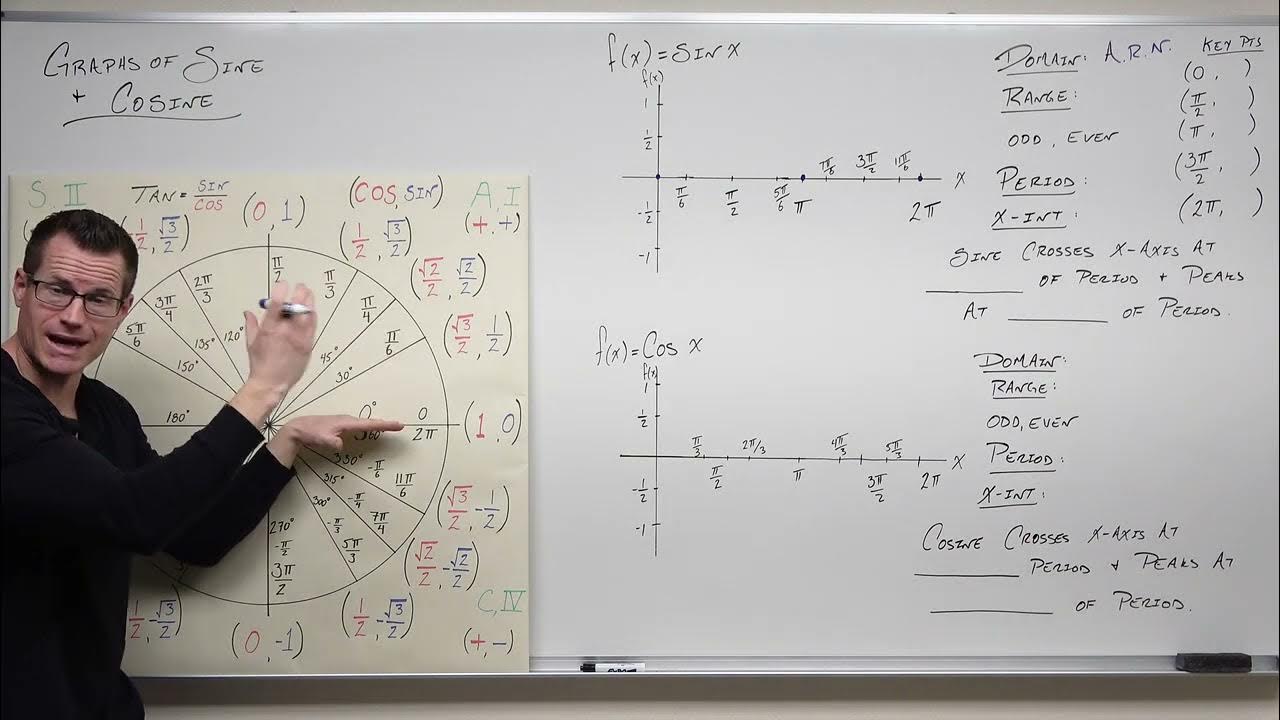
The Graphs of Sine and Cosine (Precalculus - Trigonometry 11)
How To Graph Trigonometric Functions | Trigonometry
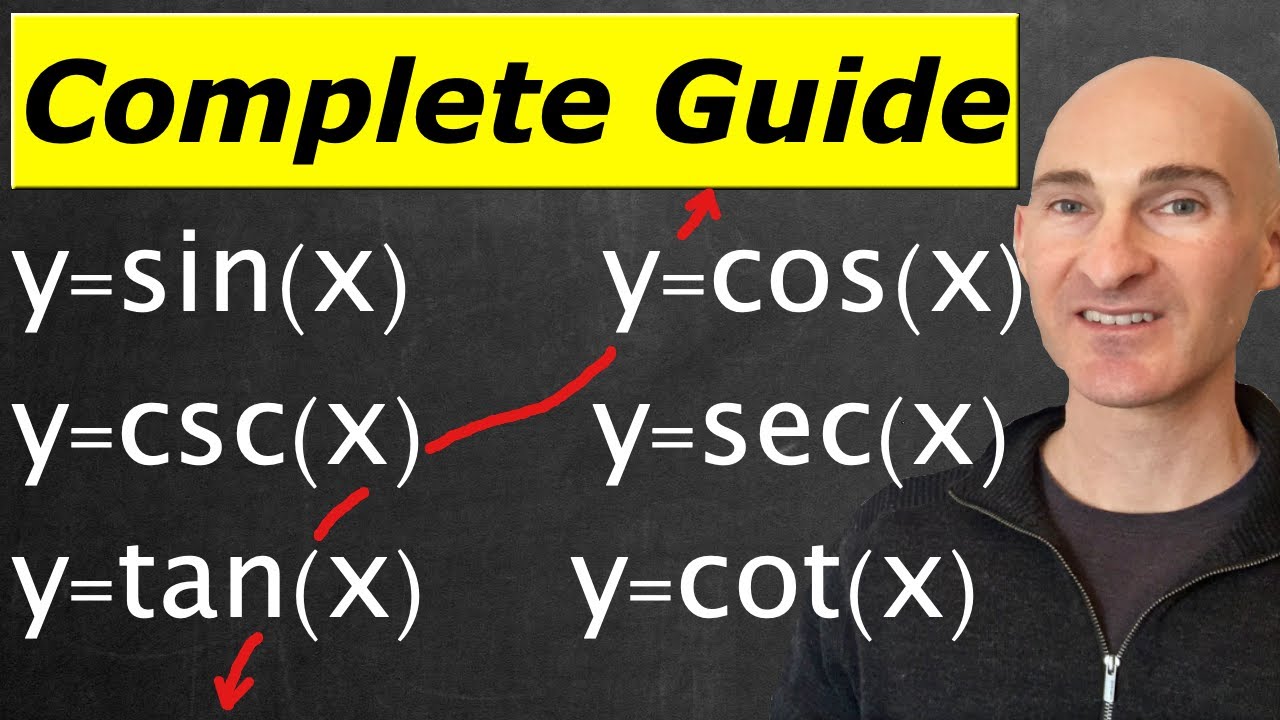
Graphing Sine, Cosine, Cosecant, Secant, Tangent & Cotangent (Complete Guide)
Graphing Trigonometric Functions, Phase Shift, Period, Transformations, Tangent, Cosecant, Cosine
Trigonometry - Graphing transformations of sin and cos
5.0 / 5 (0 votes)
Thanks for rating: