Features of Graphs, Domain, Range (Precalculus - College Algebra 7)
TLDRThe video script offers an in-depth exploration into the world of graphing functions, focusing on key concepts such as points, domain, and range. It clarifies the process of finding points on a graph by substituting values into the function to determine outputs, and emphasizes the importance of understanding the terminology. The script delves into the intricacies of determining the domain, which is the set of all input values (x-axis) that yield defined outputs, and the range, which is the set of all output values (y-axis) the function can produce. It also explains how to find specific features of graphs, such as x-intercepts and y-intercepts, by setting the function's output to zero and plugging in zero, respectively. The video aims to demystify common points of confusion, such as the difference between finding an input for a given output and vice versa, and provides a solid foundation for further study of more complex graphing concepts.
Takeaways
- 📈 Understanding Points on a Graph: Points are represented as (x, f(x)) and finding a point involves determining the output (y-value) for a given input (x-value).
- 🔍 Evaluating Function Notation: When given f(x), it asks for the output value of the function for a specific input x.
- 🤔 Positive or Negative Outputs: For questions like f(x) > 0, it's crucial to consider the intervals on the x-axis where the graph is above the x-axis, not just the individual points.
- 📉 Domain and Range Clarification: The domain refers to the interval of the x-axis that the graph covers, while the range is the interval of the y-axis (or output values) the graph covers.
- ❌ Excluding Undefined Values: The domain excludes any x-values that would result in an undefined expression, such as division by zero.
- 🔑 Finding X-Intercepts: To find x-intercepts, set the function equal to zero and solve for x, as these are the points where the graph crosses the x-axis.
- 📍 Identifying Y-Intercepts: The y-intercept is found by evaluating the function at x = 0, which gives the point where the graph crosses the y-axis.
- 🚫 Avoiding Division by Zero: When identifying the domain, exclude any x-values that would cause the denominator in a rational function to be zero.
- 🔄 Solving for Inputs Given Outputs: When finding the x-values for a specific output, replace f(x) with the output value and solve for x.
- ∞ Infinite Range Consideration: For functions with an infinite range, such as those approaching asymptotes, the domain may extend to positive or negative infinity but never actually reach certain values.
- 📐 Interval Notation Importance: Use interval notation to express the domain and range accurately, including or excluding endpoints as appropriate based on the graph's behavior.
Q & A
What is the main topic of discussion in the video?
-The main topic of discussion in the video is understanding graphs, specifically focusing on features such as points, domain, and range.
How does the video define the term 'domain' in the context of graphs?
-In the context of graphs, 'domain' refers to the interval of the x-axis that a graph covers. It represents the set of all possible input values (x-values) for which the function is defined.
What does 'range' represent in the context of a graph?
-'Range' in the context of a graph represents the interval of the y-axis or output values (f(x) values) that the graph covers. It is the set of all possible output values that you can get from the function for the given domain.
How does the video explain finding points on a graph?
-The video explains finding points on a graph by looking for the output value of the function at a given input value. For example, if asked to find f(0), you would plug in 0 into the function and find the corresponding output value, thus completing the point on the graph.
What is an 'x-intercept' and how is it found?
-An 'x-intercept' is a point where the graph of the function crosses the x-axis. To find the x-intercepts, you set the function's output (f(x)) equal to zero and solve for x, which gives you the x-values where the graph intersects the x-axis.
How does the video differentiate between finding an output given an input and finding an input given an output?
-When finding an output given an input, you are asked to plug in the input value into the function to find the corresponding output value. Conversely, when finding an input given an output, you set the function equal to the output value and solve for the input value (x).
What is the significance of the 'vertical line test' in determining if a graph represents a function?
-The 'vertical line test' is a graphical method to verify if a relation is a function. If a vertical line intersects the graph at more than one point, then the relation does not pass the test and is not a function. A function must pass the test, meaning each input value must correspond to exactly one output value.
What does the video imply about the relationship between the domain and the range of a function?
-The video implies that the domain and range of a function are interrelated but distinct. The domain is the set of all possible x-values that produce a valid output, while the range is the set of all output values that the function can produce. Together, they describe the overall behavior and output of the function.
How does the video handle the concept of 'points' on a graph?
-The video handles the concept of 'points' on a graph by showing how to find specific points by plugging in x-values to find corresponding y-values (outputs), and vice versa. It also discusses how to determine whether a point lies on the graph by evaluating the function at given x-values.
What are the two common issues that affect the domain of a function, as mentioned in the video?
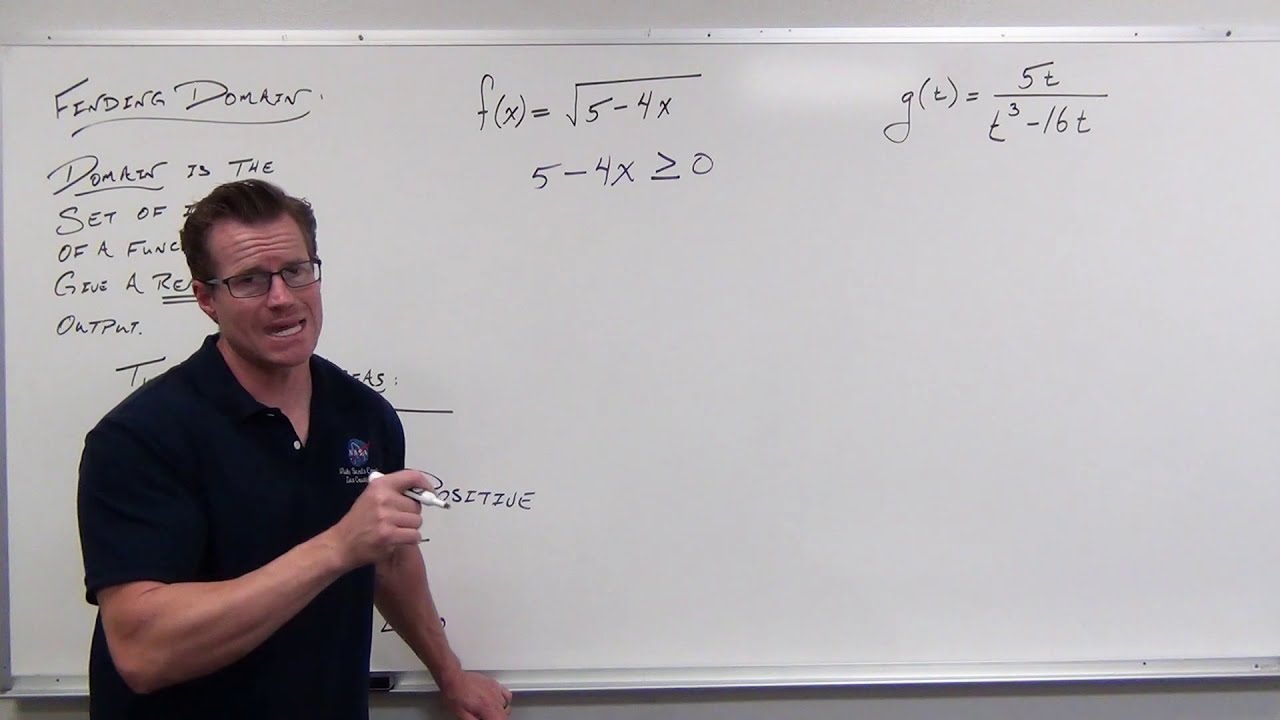
-The two common issues that affect the domain of a function are the presence of square roots (which require the radicand to be non-negative) and denominators (which cannot be zero, as division by zero is undefined).
How does the video approach the concept of 'interval notation' in relation to the domain and range?
-The video approaches 'interval notation' by showing how to represent the domain and range using mathematical notation that includes parentheses and brackets to indicate whether endpoints are included or excluded. This notation is crucial for specifying the intervals of the x-axis and y-axis that the graph of the function covers.
Outlines
📈 Introduction to Graphs and Terminology
The video begins with an introduction to the topic of graphs, emphasizing the importance of understanding key features such as points, domain, and range. The presenter clarifies that the video will not cover an exhaustive list but will focus on fundamental concepts that are often confusing. The discussion includes how to find points on a graph, the meaning of function notation like F(0) or F(-6), and the difference between domain and range. The presenter also promises to address common student misconceptions and to explain how to find this information without a visual graph.
🔍 Understanding Points and Function Notation
This paragraph delves into the specifics of finding points on a graph and interpreting function notation. It explains how to determine if a function's output is positive or negative for a given input value. The presenter also discusses how to find values of X for which the function F(X) equals zero, which is related to finding X-intercepts. Additionally, the concept of intervals on the X-axis is introduced, showing how to determine where the graph is positive or negative.
📉 Identifying Intervals and Function Behavior
The focus shifts to identifying intervals on the X-axis where the graph is above or below the X-axis. The presenter clarifies that this involves understanding the intervals of X-values that correspond to positive or negative outputs of the function. The concept of strict inequalities is introduced to describe intervals where the graph is strictly positive or negative, excluding endpoints where the output is zero.
🈯️ Domain and Range: Defining the Coverage
The concept of domain is explored, which refers to the interval of the X-axis that the graph covers. The presenter explains how to determine the domain by looking at the X-values the graph includes. The range, which is the interval of the Y-axis that the graph covers, is also discussed. The video touches on how to find X-intercepts and Y-intercepts, and the difference between them is highlighted.
🤔 Dealing with Discontinuities and Asymptotes
This paragraph addresses more complex scenarios involving discontinuities and asymptotes. The presenter explains how to define the domain and range when points are missing from the graph, such as removable discontinuities. The concept of horizontal asymptotes in exponential functions is also introduced, and how they affect the range of the graph is discussed.
🧮 Solving for Points and Domain without a Graph
The presenter challenges the viewer to find points and determine the domain and range without a visual graph. This involves algebraic manipulation of the function's formula. The process of finding points is demonstrated by plugging in given input values to find the corresponding output. The domain is found by ensuring that the function's denominators are not zero and that square roots are of non-negative numbers. The presenter also shows how to find X-intercepts by setting the function's output to zero and solving for X.
📚 Summary of Key Graphing Concepts
The video concludes with a summary of the key concepts covered. The presenter reiterates the importance of understanding points on a graph, the domain and range of a graph, and how to find them. The difference between finding an input given an output and vice versa is clarified. The process for finding X-intercepts and Y-intercepts is also summarized, with an emphasis on the algebraic approach to these problems.
Mindmap
Keywords
💡Graph
💡Points
💡Domain
💡Range
💡Function Notation
💡X-intercepts
💡Y-intercept
💡Interval Notation
💡Positive and Negative Outputs
💡Graphing without a Graph
💡Rational Functions
Highlights
Explains the basics of graphing functions, focusing on points, domain, and range.
Clarifies how to find points on a graph by completing points with given inputs or outputs.
Discusses the concept of domain as the interval of the x-axis that a graph covers.
Introduces the concept of range as the interval of the y-axis that a graph covers.
Provides examples of how students often get confused about the domain and range of a graph.
Demonstrates how to find x-intercepts by setting the function's output to zero.
Shows how to determine the y-intercept by plugging in zero for the x-value.
Explains the difference between x-intercepts and y-intercepts and how to find them.
Discusses how to find the domain of a function, especially when dealing with denominators and square roots.
Illustrates how to handle points on a graph that are missing, referred to as removable discontinuity.
Provides a method to find points on a graph without the actual picture, using algebraic manipulation.
Includes a detailed walkthrough on solving for x when given an output value, using a rational function as an example.
Stresses the importance of understanding the one-to-one correspondence between inputs and outputs in functions.
Teaches how to find the domain and range of various types of functions, including those with asymptotes and discontinuities.
Uses interval notation to express the domain and range of functions, including how to represent open and closed intervals.
Addresses common student misconceptions about the interpretation of function notation, such as f(x) when x equals a specific value.
Offers strategies for finding points on a graph by determining whether the output is positive or negative for a given input.
Concludes with a summary of key concepts and a preview of upcoming topics, such as even and odd functions.
Transcripts
Browse More Related Video
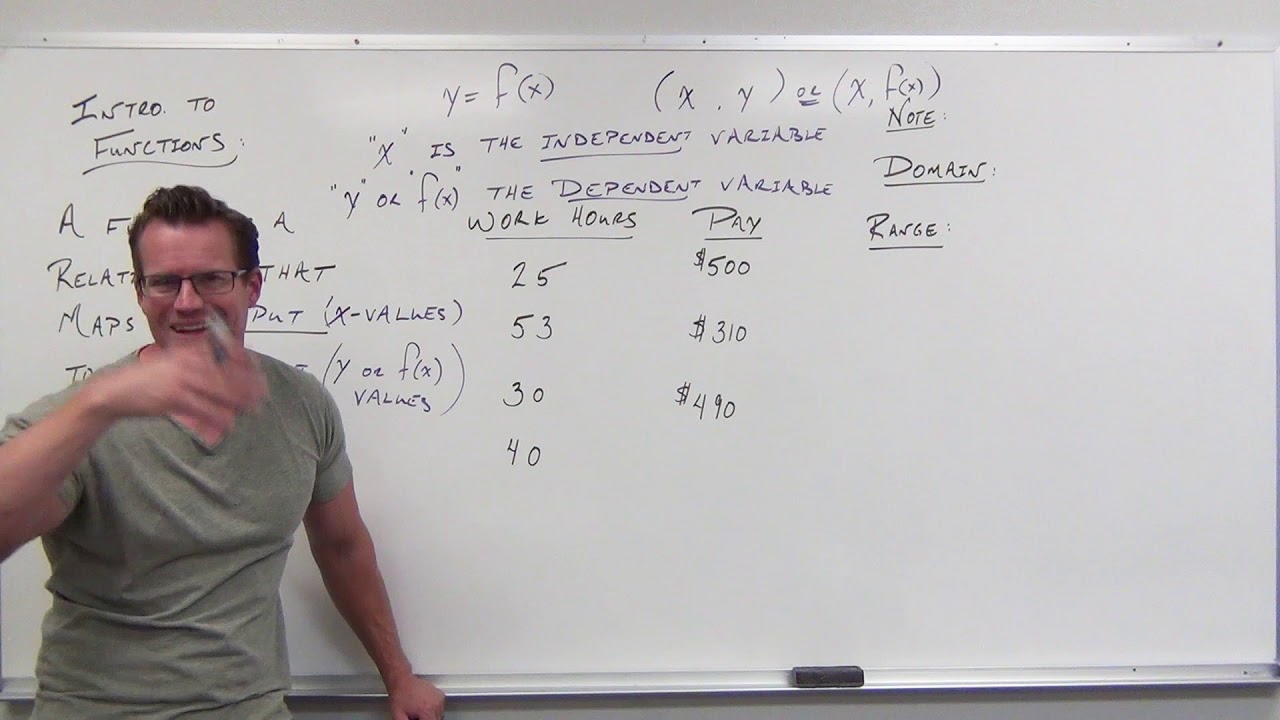
Introduction to Functions (Precalculus - College Algebra 2)
Back to Algebra: What are Functions?
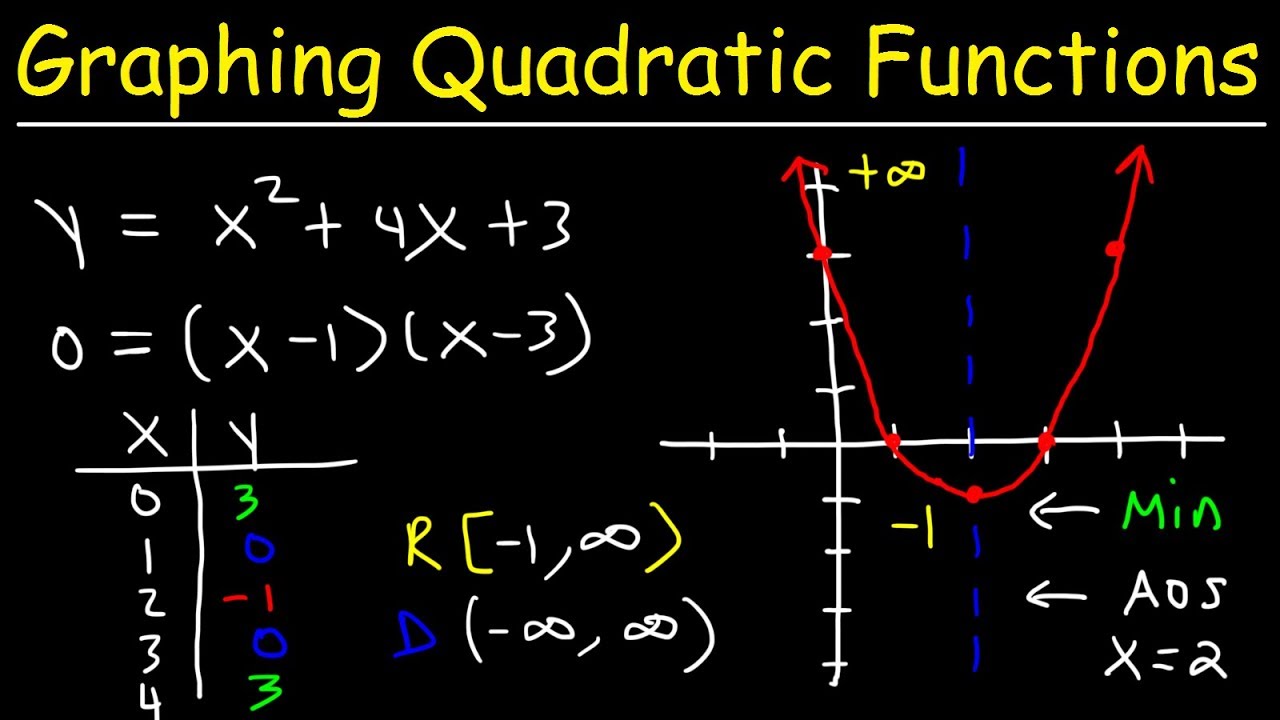
Graphing Quadratic Functions In Standard Form Using X & Y Intercepts | Algebra
Draw Cubic Graph Grade 12
Finding the Domain of Functions (Precalculus - College Algebra 4)
Business Calculus - Section 1.2 - Graphs of Functions
5.0 / 5 (0 votes)
Thanks for rating: