How To Graph Trigonometric Functions | Trigonometry
TLDRThe video script delves into the intricacies of graphing trigonometric functions, focusing on the sine and cosine functions. It explains how the presence of a negative sign affects the graph, causing it to flip over the x-axis. The concept of amplitude, period, and vertical shifts are discussed, with examples provided to illustrate how these modifications alter the graph. The importance of understanding the domain and range of these functions is emphasized, and the process of graphing with phase shifts is outlined. The script serves as a comprehensive guide to visualizing and understanding the behavior of sine and cosine waves in various mathematical contexts.
Takeaways
- 📈 The sine function (sin(x)) represents a sinusoidal wave, with one period ending at 2π, completing one cycle of the wave.
- 🔄 Negative values in the sine function (sin(-x)) result in a wave that flips over the x-axis, starting from the origin and alternating between positive and negative values.
- 📊 The cosine function (cos(x)) differs from sine in that it starts at the top of the wave, while sine starts from the center.
- 🌀 Both sine and cosine functions extend infinitely in both directions, but the focus is often on graphing one period or cycle for simplicity.
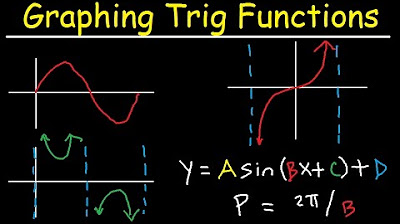
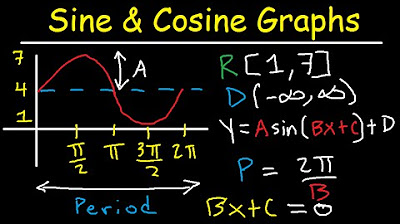
- 🔢 The amplitude (a) of a sine wave, represented as a*sin(bx + c) + d, determines the vertical stretch or compression of the wave, with the amplitude being the absolute value of 'a'.
- 📐 The period of a sine or cosine function is found by dividing 2π by the coefficient 'b' in front of 'x', indicating how many units fit into one cycle.
- 🔄 For functions like y = -3cos(x), the amplitude is the absolute value of the coefficient, which is 3 in this case, ignoring the negative sign.
- 📈 When graphing, breaking a cycle into four or five key points helps in plotting the wave more accurately, especially considering the intervals between these points.
- 🔄 Vertical shifts in the graph are represented by the 'c' value in the function, which indicates a phase shift to the left or right, calculated by setting bx + c = 0 and solving for 'x'.
- 📊 The domain of sine and cosine functions is all real numbers, while the range depends on the amplitude and any vertical shifts, varying from the lowest to the highest 'y' values.
Q & A
What is the basic shape of the sine function?
-The sine function has a sinusoidal shape, resembling a wave that oscillates between positive and negative values around the x-axis.
What happens to the sine graph when a negative sign is placed in front of the sine function?
-Placing a negative sign in front of the sine function flips the graph over the x-axis, causing the wave to start from the origin, go down, then back up, and then back down, continuing this pattern.
How does the cosine function differ from the sine function in terms of its starting point?
-The cosine function starts at the top of the wave, whereas the sine function starts at the center of the wave.
What is the effect of the amplitude on the sine wave?
-The amplitude of the sine wave determines how much the wave stretches or compresses vertically. It is represented by the absolute value of 'a' in the equation 'a * sin(bx + c) + d'.
How do you find the period of a sine or cosine function?
-The period of a sine or cosine function is found by dividing 2π by the coefficient 'b' in front of the 'x'. The period represents the length of one complete cycle of the wave.
What is the domain and range of sine and cosine graphs?
-The domain of sine and cosine graphs is all real numbers, while the range is based on the amplitude. The lowest y-value is the negative amplitude, and the highest y-value is the amplitude.
How does a vertical shift affect the graph of a sine or cosine function?
-A vertical shift adds or subtracts a constant value 'c' from the entire graph, raising or lowering it along the y-axis without changing the shape of the wave.
What is a phase shift in the context of sine and cosine functions, and how do you calculate it?
-A phase shift causes the graph of a sine or cosine function to shift either to the right or left. It is calculated by setting the inside of the function (bx + c) to zero and solving for 'x' to find the horizontal shift from the origin.
How does the coefficient 'b' in front of 'x' in a sine or cosine function affect the graph?
-The coefficient 'b' affects the period of the function. A smaller 'b' value results in a longer period and a more compressed wave, while a larger 'b' value results in a shorter period and a more stretched wave.
What are key points for graphing one cycle of the sine wave?
-For graphing one cycle of the sine wave, key points include the start at the center, the peak (highest point), the midpoint, the trough (lowest point), and back to the midpoint, representing half or one full period of the wave.
How do you graph a sine function with both a phase shift and an amplitude change?
-First, identify the phase shift by setting the function inside equal to zero and solving for 'x' to find the starting point. Then, adjust the amplitude by considering the absolute value of 'a'. Plot the key points according to the phase shift and amplitude, and connect them to form the wave.
Outlines
📊 Understanding Sine and Cosine Functions
This paragraph introduces the sine (sin(x)) and cosine (cos(x)) functions, focusing on their graphical representations. The sine function is described as a sinusoidal wave, with one period ending at two pi (2π), representing one complete cycle. The effect of a negative sign on the sine function is explained, illustrating how it flips the graph over the x-axis. The cosine function is compared to sine, with its starting point at the top as opposed to the center for sine. The paragraph also discusses graphing one period of sine and cosine functions by breaking them down into four useful points, and the concept of amplitude is introduced with the general formula a*sin(bx + c) + d, emphasizing the role of 'a' as the amplitude.
📈 Amplitude and Period Adjustments
The paragraph delves into how the amplitude and period of trigonometric functions affect their graphs. It explains that the amplitude, represented by 'a', dictates the vertical stretch or compression of the sine wave, ranging from 'a' to negative 'a'. The period, determined by 'b', is the length of one cycle and is found by dividing 2π by 'b'. Examples are provided to illustrate the effect of changing the amplitude and the calculation of the period for different functions, such as two sine x and negative three cosine x. The domain and range of these functions are also discussed, noting that the domain is all real numbers and the range depends on the amplitude and vertical shift.
📉 Graphing with Fractions and Vertical Shifts
This section continues the discussion on graphing trigonometric functions, focusing on how fractions in front of 'x' affect the horizontal stretch of the graph. The example of two sine (1/2)x is used to demonstrate a horizontal stretch, resulting in a period of 4π. Another example, 4 cosine (π)x, shows how identifying amplitude and period leads to graphing the function. The concept of vertical shifts is introduced with the function sine x + 3, where a horizontal line represents the new midline of the graph, and the amplitude dictates the variation from the midline.
🔄 Phase Shifts in Trigonometric Functions
The concept of phase shifts is explored in this paragraph, explaining how 'c' in the general formula a*sin(bx + c) + d represents a horizontal shift. The phase shift is calculated by setting the inside of the function equal to zero and solving for 'x'. The paragraph provides a step-by-step guide on graphing the function sine x - π/2, including plotting the phase shift, adding one period, and determining key points on the graph. Another example, 2 sine x - π/4 + 3, is used to illustrate the combined effects of vertical shift, amplitude, and phase shift on the graph of a trigonometric function.
🔄 Further Exploration of Phase Shifts
This paragraph further examines phase shifts in trigonometric functions, using the example of 2 sine x - π/4 + 3 to illustrate how to graph a function with a phase shift. The vertical shift is first plotted, followed by calculating the amplitude and period. The graph is then constructed by plotting key points and understanding how the phase shift affects the starting position of the sine wave. The range of the function is determined by the amplitude and the vertical shift, and the graph is completed by plotting the sine wave over one period.
Mindmap
Keywords
💡Sine Function
💡Cosine Function
💡Amplitude
💡Period
💡Phase Shift
💡Vertical Shift
💡Graphing
💡Domain
💡Range
💡Trigonometric Functions
💡Sinusoidal Wave
Highlights
The sine function, sine x, is a sinusoidal function representing a sine wave.
The graph of sine x has one period ending at two pi, representing one cycle of the wave.
A negative sign in front of the sine function flips the graph over the x-axis.
The cosine function, cosine x, starts at the top, unlike sine which starts at the center.
Negative cosine x starts at the bottom and follows a similar pattern to cosine x but inverted.
Graphing one period of sine or cosine involves breaking it into four useful points.
The amplitude of a sine wave is represented by 'a' in the formula a * sine(bx + c) + d.
The period of a sine function is found by dividing two pi by 'b'.
Graphing sine and cosine functions involves identifying key points and intervals.
The domain of sine and cosine graphs is all real numbers.
The range of a graph is determined by the amplitude and any vertical shifts.
Vertical shifts are represented by 'c' in the formula and indicate a change in the midline of the graph.
Phase shifts are represented by 'b' in the formula and affect the horizontal positioning of the graph.
To graph a function with a phase shift, set the inside of the function equal to zero and solve for x to find the shift.
Graphing functions with both phase and vertical shifts requires plotting the shifts first, then following the sine or cosine pattern.
The majority of a graph's period above the x-axis indicates a positive phase shift.
To find the end of a period with a phase shift, add the period to the phase shift and find common denominators.
Graphing a sine wave with a phase shift involves starting at the phase shift point and following the sine wave pattern.
Combining phase and vertical shifts in graphing requires careful plotting of the center line and key points.
Transcripts
Browse More Related Video
Graphing Trigonometric Functions, Phase Shift, Period, Transformations, Tangent, Cosecant, Cosine

How to Graph Phase Shifts of Trigonometric Functions (Precalculus - Trigonometry 16)
Graphing Sine and Cosine Trig Functions With Transformations, Phase Shifts, Period - Domain & Range

Graphing Transformations with Sine and Cosine (Precalculus - Trigonometry 12)

GRAPHS OF SINE AND COSINE FUNCTIONS || PRE-CALCULUS

Trigonometry - Graphing transformations of sin and cos
5.0 / 5 (0 votes)
Thanks for rating: