A/B Testing Analysis Made Easy: How to Use Hypothesis Testing for Data Science Interviews!
TLDRThis video tutorial explores the application of hypothesis testing in solving real-world problems, particularly in analyzing A/B testing results. The host provides two detailed examples, explaining step-by-step how to use a Z-test for Bernoulli populations and a two-sample t-test for comparing means with similar variances. The video also discusses the importance of statistical and practical significance in decision-making, guiding viewers on when to recommend launching a feature based on experimental results.
Takeaways
- 🔍 The video is a tutorial on using hypothesis testing to analyze results of A/B testing in real-world problems.
- 📚 Part two of a series on hypothesis testing in data science interviews, following up on commonly used tests and their differences.
- 🎯 The first example discusses an experiment on button color and its effect on click-through probability, with a significant difference to be determined.
- 📉 The control group has a 1.1% click-through rate, while the treatment group has 2.3%, prompting a hypothesis test for significant difference.
- 📝 A practical significance boundary of 0.01 and an alpha level of 0.05 are set to assess statistical and practical significance.
- 🧐 The hypothesis test chosen for the first example is a z-test, appropriate for large Bernoulli populations.
- 📊 The test statistic is calculated using the estimated probabilities from both groups, with a standard error derived from pooled data.
- 📈 The result of the z-test shows statistical significance as the test statistic exceeds the critical value for the given alpha level.
- 🤔 Despite statistical significance, the practical significance is questionable as the confidence interval marginally overlaps the practical boundary.
- 🚫 The recommendation based on the analysis is not to launch the feature due to uncertainty in practical significance.
- 📝 The second example involves a t-test to determine if a new feature affects the average number of posts per user, with a significant difference to be assessed.
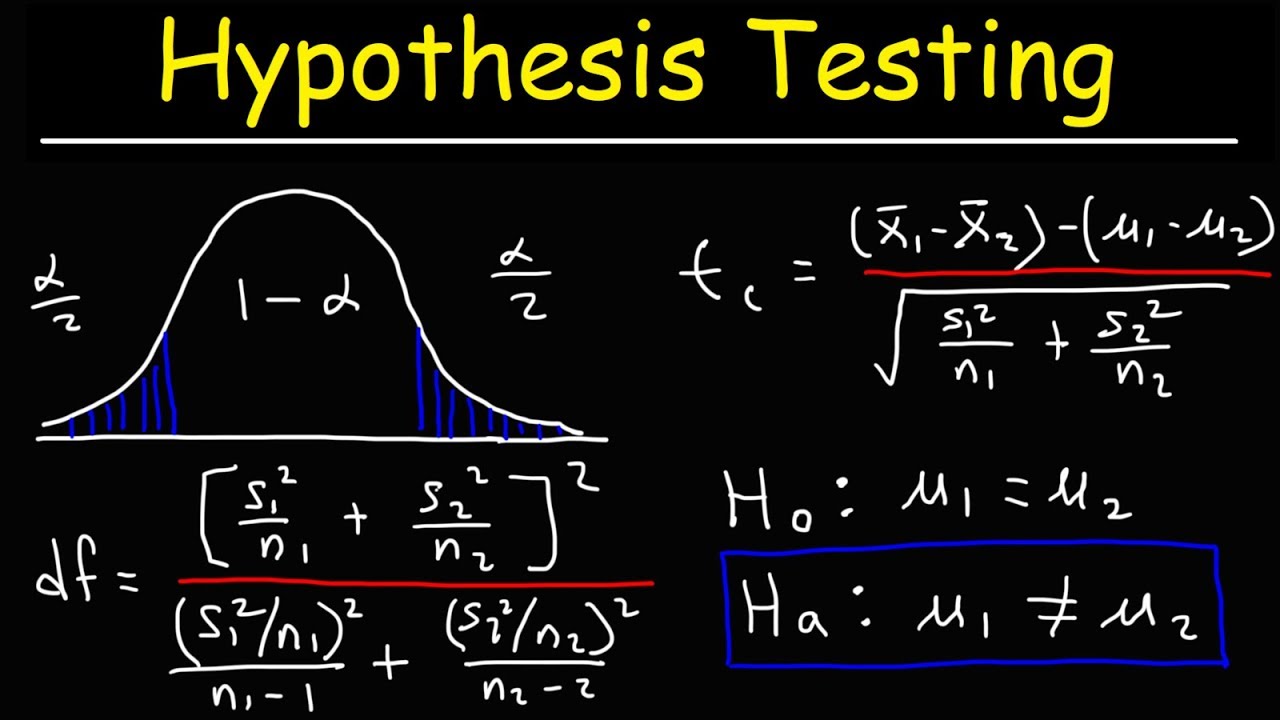
- 📊 A two-sample t-test with pooled variance is chosen for the second example, assuming similar variances in both groups.
- 📈 The t-test result is statistically significant, and the confidence interval does not include zero, indicating a practical difference.
- 🟢 The recommendation for the second experiment is to launch the feature, as the difference is both statistically and practically significant.
- 📚 The video also touches on unequal variance t-tests for cases where the sample variances are significantly different.
Q & A
What is the main topic of the video?
-The main topic of the video is how to use hypothesis testing to solve real problems, specifically analyzing the results of A/B testing in data science.
What is the purpose of the video in the context of a series?
-The video is part two of a series on cracking hypothesis testing problems in data science interviews, following up on commonly used hypothesis tests from part one.
What metric is being analyzed in the first experiment about the button color?
-The metric being analyzed is the click-through probability, which is calculated as the number of users who click the button over the total number of users.
What are the click-through probabilities for the control and treatment groups in the first experiment?
-The control group has a 1.1 percent click-through probability, while the treatment group has a 2.3 percent click-through probability.
What is the significance of choosing an alpha of 0.05 in the first experiment?
-Choosing an alpha of 0.05 sets the threshold for statistical significance, meaning that if the test statistic exceeds this value, the null hypothesis can be rejected.
What type of hypothesis test is chosen for the first experiment, and why?
-A z-test is chosen for the first experiment because the data involves large samples from a Bernoulli population, and the test statistic follows a standard normal distribution.
How is the estimated difference in probabilities between the control and treatment groups calculated in the first experiment?
-The estimated difference is calculated by subtracting the estimated probability of the control group from the estimated probability of the treatment group, which results in 0.01.
What is the practical significance boundary in the first experiment, and how does it relate to the decision to launch the feature?
-The practical significance boundary is 0.01, and it is used to determine whether the observed difference in click-through probabilities is large enough to be worth implementing. If the confidence interval does not entirely exceed this boundary, the feature should not be launched.
What is the second experiment about, and what is the metric being tested?
-The second experiment is about testing if adding a new feature changes the average number of posts created per user. The metric being tested is the mean number of posts.
What statistical test is used in the second experiment, and under what condition is it appropriate?
-A two-sample t-test is used in the second experiment, which is appropriate when comparing the means of two groups with similar variances and unknown population variances.
What is the conclusion of the second experiment regarding the practical significance of the new feature?
-The conclusion is that the new feature should be launched because both ends of the confidence interval for the difference in means are greater than the practical significance boundary of 0.05.
What is the Welch's t-test, and when should it be used instead of the two-sample t-test with pooled variance?
-Welch's t-test is used when the two samples have very different variances or sample sizes, and it calculates the standard error and degrees of freedom differently to account for the unequal variances.
Outlines
🔍 Hypothesis Testing for A/B Testing Analysis
This paragraph introduces the video's focus on using hypothesis testing to address real-world problems, specifically analyzing A/B testing results. The video provides a step-by-step guide on hypothesis testing, including choosing the right test, formulating the null hypothesis, evaluating statistical significance, and assessing practical significance with examples. The first example involves an experiment on button color's effect on click-through probability, comparing two groups with a significant difference in click rates. The practical significance boundary is set at 0.01, with an alpha level of 0.05 for decision-making. The z-test is chosen for analysis due to large sample sizes, and the process includes calculating the test statistic, comparing it with critical values, and making a recommendation based on statistical and practical significance.
📊 Statistical and Practical Significance in Experiment Results
The second paragraph delves into the statistical significance of an experiment's results and the decision-making process based on those results. It discusses the calculation of the confidence interval and margin of error for the difference in click-through probabilities between two groups. The practical significance boundary is compared with the confidence interval to determine whether the observed change is significant enough to recommend launching a feature. The paragraph also explains how to use the confidence interval to check for statistical significance by comparing it with zero. The discussion moves on to another example involving a new feature's impact on the average number of posts created per user, using a two-sample t-test to compare group means and variances, leading to a recommendation to launch the feature based on the statistically and practically significant difference.
📚 Advanced Hypothesis Testing Scenarios and Recommendations
The final paragraph addresses more complex hypothesis testing scenarios, such as when sample sizes and variances are significantly different between two groups. It introduces the Welch's t-test as an adaptation of the Student's t-test for such cases, explaining the calculation of the separate variances and the use of a different standard error. The paragraph emphasizes the importance of understanding when to apply different tests and provides a formula for calculating the confidence interval in these scenarios. The video concludes with a summary of the examples covered and an invitation for feedback, reinforcing the importance of hypothesis testing in making informed decisions based on experimental data.
Mindmap
Keywords
💡Hypothesis Testing
💡A/B Testing
💡Click-Through Probability
💡Control Group
💡Treatment Group
💡Statistical Significance
💡Practical Significance
💡Z-Test
💡Pooled Standard Error
💡Two-Sample T-Test
💡Unpooled Standard Error
Highlights
Introduction to using hypothesis testing to solve real problems, specifically analyzing A/B testing results.
Two examples provided to demonstrate solving hypothesis testing problems step by step.
Part two of a series on hypothesis testing in data science interviews, following up on commonly used tests from part one.
First example involves analyzing the click-through probability of a button color experiment with 1000 users in control and treatment groups.
Control group has a 1.1% click-through probability, while the treatment group has 2.3%.
Decision on whether to launch the experiment based on a practical significance boundary of 0.01 and an alpha of 0.05.
Outline of steps to analyze results including choosing the right hypothesis test, evaluating statistical significance, and making decisions.
Explanation of choosing a z-test for large sample sizes and estimating the difference in probabilities.
Calculation of the pooled standard error for comparing two samples.
Determination of statistical significance by comparing the test statistic with the critical z-score.
Practical significance assessed by comparing the confidence interval with the practical significance boundary.
Recommendation not to launch the feature due to uncertainty in the practical significance of the change.
Second example involves testing the impact of a new feature on the average number of posts created per user.
Control group mean is 1.4, treatment group mean is 2, with similar variances assumed.
Use of a two-sample t-test with pooled variance for comparing differences between control and treatment groups.
Statistical significance determined by comparing the test statistic with the critical t-score for a 95% confidence level.
Recommendation to launch the feature based on the confidence interval exceeding the practical significance boundary.
Introduction of Welch's t-test for cases with very different variances or sample sizes.
Explanation of the formula for calculating the Welch's t-test standard error and degrees of freedom.
Summary of the process for using hypothesis testing in real-world scenarios to make data-driven decisions.
Transcripts
Browse More Related Video
Hypothesis Testing - Difference of Two Means - Student's -Distribution & Normal Distribution

t-Test - Full Course - Everything you need to know

SPSS (9): Mean Comparison Tests | T-tests, ANOVA & Post-Hoc tests
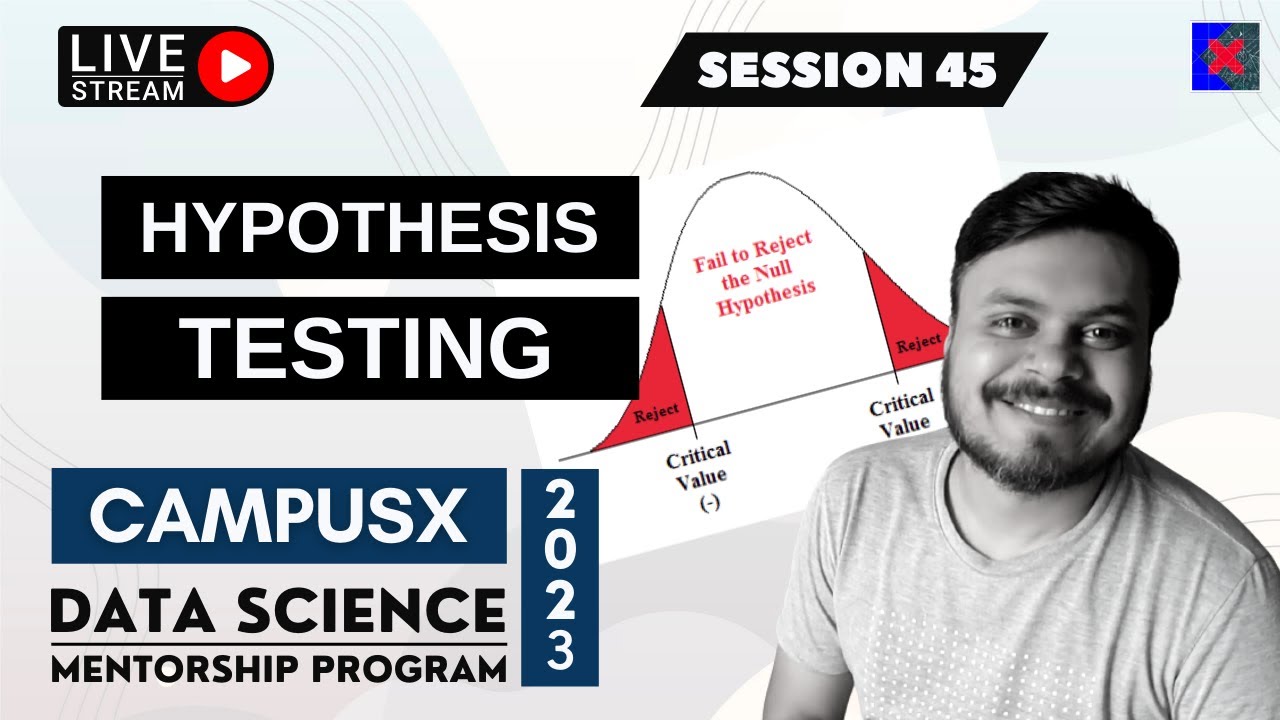
Session 45 - Hypothesis Testing Part 1 | DSMP 2023
Two-Sample t Test in R (Independent Groups) with Example | R Tutorial 4.2 | MarinStatsLectures

What is Effect Size ? Explained in a simple and Easy way
5.0 / 5 (0 votes)
Thanks for rating: