Normal Distribution: Calculating Quantiles {TI 84 Plus CE}
TLDRThis video script explains how to use a graphing calculator to find the cutoff scores for schools in a contest, based on statistical distributions. It demonstrates finding the minimum score needed to be in the top 70% and top 10% using the inverse norm function, with a normal distribution graph having a mean of 11 and a standard deviation of 3. The process involves calculating the K value for the desired percentile, taking into account the calculator's method of finding areas to the left of K. The video provides step-by-step instructions for using the TI-84 Plus CE calculator to solve these problems.
Takeaways
- 📈 The video demonstrates a normal distribution graph with a mean of 11 and a standard deviation of 3.
- 🏆 It presents a scenario where schools are in a contest, and to advance, they need to be in the top 70%, implying a cutoff at the bottom 30%.
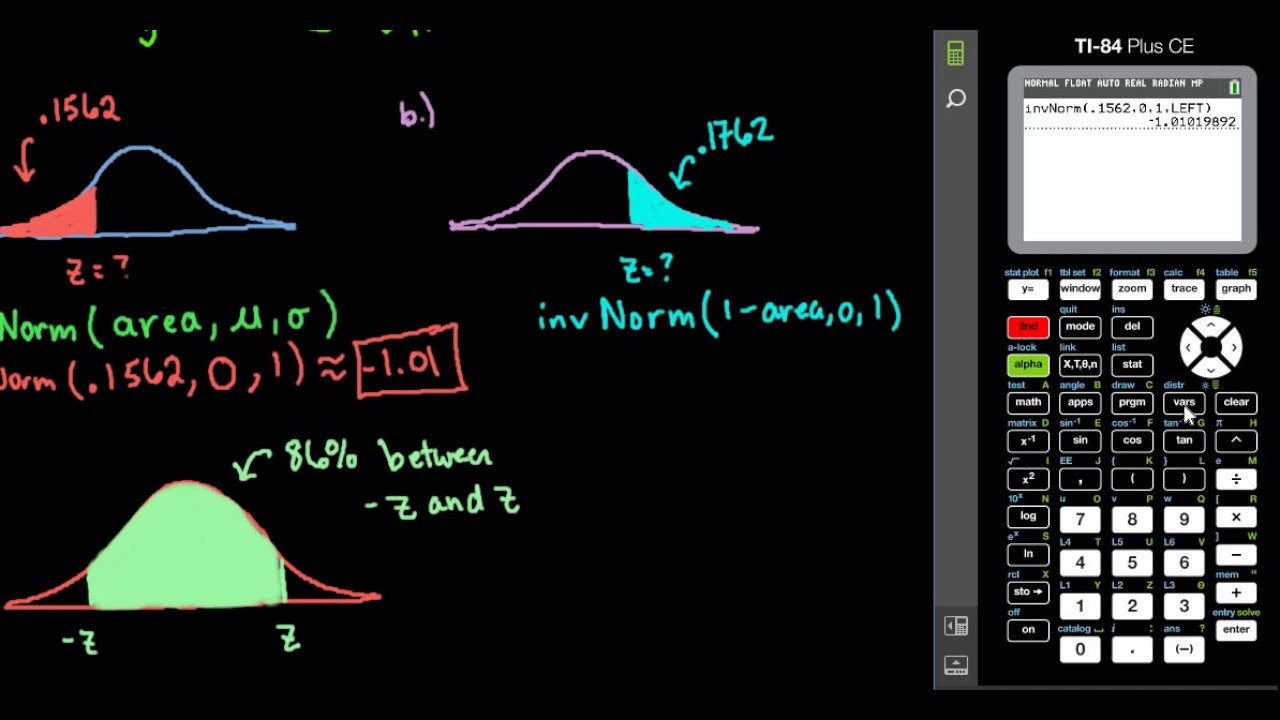
- 🔍 The goal is to find the value 'K' such that the area under the normal curve to the left of 'K' is 30% or 0.3.
- 🧮 The video explains using a graphing calculator to find 'K' by setting the probability of an 'x' value being less than 'K' to 0.3.
- 📱 The TI-84 Plus calculator is used to find 'K' by using the inverse norm function, which calculates the area to the left of 'K'.
- 📊 The calculator is instructed to find the area to the left of 'K' with a probability of 0.3, using the given mean and standard deviation.
- 🤔 The video then shifts focus to finding the top 10%, which requires a different approach to calculate 'K'.
- 🔄 For the top 10%, the calculator must find the area to the left of 'K' that is not 10%, but instead 90%, by using 1 - 0.1.
- 📝 The video emphasizes that the TI-84 Plus calculator only finds the area to the left of 'K', so the question must be rephrased to find the correct 'K' value.
- 🎯 The final 'K' values are approximately 9.43 for the bottom 30% and 14.84 for the top 10% of the distribution.
- 📚 The key takeaway is understanding how to use the inverse function of the calculator to find the correct 'K' value based on the desired percentile.
Q & A
What is the mean of the normal distribution graph presented in the video?
-The mean of the normal distribution graph is eleven.
What is the standard deviation of the normal distribution graph in the video?
-The standard deviation is three.
What does the video suggest is necessary for a school to advance to the next round in the contest?
-To advance to the next round, a school must be in the top 70%, which means it should not be in the bottom 30%.
What is the value 'K' in the context of the video?
-The value 'K' represents the score or point on the normal distribution graph where the cumulative area to the left of 'K' is 30% or 0.3, indicating the bottom 30% of schools.
How can one find the value 'K' using a graphics calculator?
-To find 'K', you can use the inverse norm function on a graphics calculator, inputting the desired area (0.3 for the bottom 30%), the mean (11), and the standard deviation (3).
What is the approximate value of 'K' for the bottom 30% as calculated in the video?
-The approximate value of 'K' for the bottom 30% is 9.43.
What if the interest is in finding the top 10% instead of the bottom 30%?
-If you are interested in the top 10%, you need to find the K value for which the area to the left is 90% (1 - 0.1), because the calculator finds the area to the left of K.
What is the approximate value of 'K' for the top 10% as calculated in the video?
-The approximate value of 'K' for the top 10% is 14.84.
Why do you need to adjust the question when looking for the top percentage using the calculator?
-You need to adjust the question because the calculator finds the area to the left of 'K', so for the top percentage, you calculate the complement to 1 and find the area to the left for that complement.
What is a key takeaway from the video regarding the use of the inverse function on a TI-84 Plus CE calculator?
-The key takeaway is that the inverse function on the TI-84 Plus CE calculator only finds the area to the left of 'K', so you must reframe the question to find the correct K value for the desired percentile.
Outlines
📊 Understanding Normal Distribution and Percentiles
This paragraph introduces a normal distribution graph with a mean of 11 and a standard deviation of 3, using a hypothetical scenario of schools in a contest. The goal is to determine the minimum score (K value) that places a school in the top 70%, thus advancing to the next round. The explanation involves finding the probability that an x-value is less than K, where the area under the curve to the left of K is 30% or 0.3. The TI-84 Plus calculator is used to find this K value by using the inverse norm function, which calculates the area to the left of K for a given probability. The process is demonstrated with the calculator, yielding an approximate K value of 9.43 for the top 70%.
Mindmap
Keywords
💡Normal Distribution
💡Mean
💡Standard Deviation
💡Top 70%
💡Cutoff Point
💡Inverse Norm
💡Probability
💡Graphical Calculator
💡Area Under the Curve
💡Percentile
Highlights
Introduction of a normal distribution graph with a mean of 11 and a standard deviation of 3.
Explanation of a contest scenario where schools need to be in the top 70% to advance.
The goal is to find the value K, where the area under the curve to the left of K is 30%.
Using a graphics calculator to find the value K for a given probability.
Navigating to the 'inverse norm' function on the calculator to solve for K.
Entering the area to the left of K as 0.3 (30%) to find the minimum score for advancement.
Inputting the mean (11) and standard deviation (3) into the calculator.
Revealing the calculated K value of approximately 9.43 for the top 70%.
Exploring the scenario of finding the top 10% of scores.
Understanding that the calculator finds the area to the left of K, requiring a reverse approach for top percentages.
Adjusting the problem to find the area to the left of K as 90% to solve for the top 10%.
Entering the adjusted probability of 0.9 into the calculator for the top 10% scenario.
Calculating the new K value for the top 10%, which is approximately 14.84.
Emphasizing the importance of understanding how the calculator finds areas to the left of K.
Highlighting the need to adjust the question when looking for top percentages to find the correct K value.
Concluding with a summary of the process and the importance of correctly using the calculator's inverse function.
Transcripts
Browse More Related Video
Finding Z-score Given Area - TI-84
normalCDF & InvNorm on TI-84 Plus Calculator: Normal Calculations
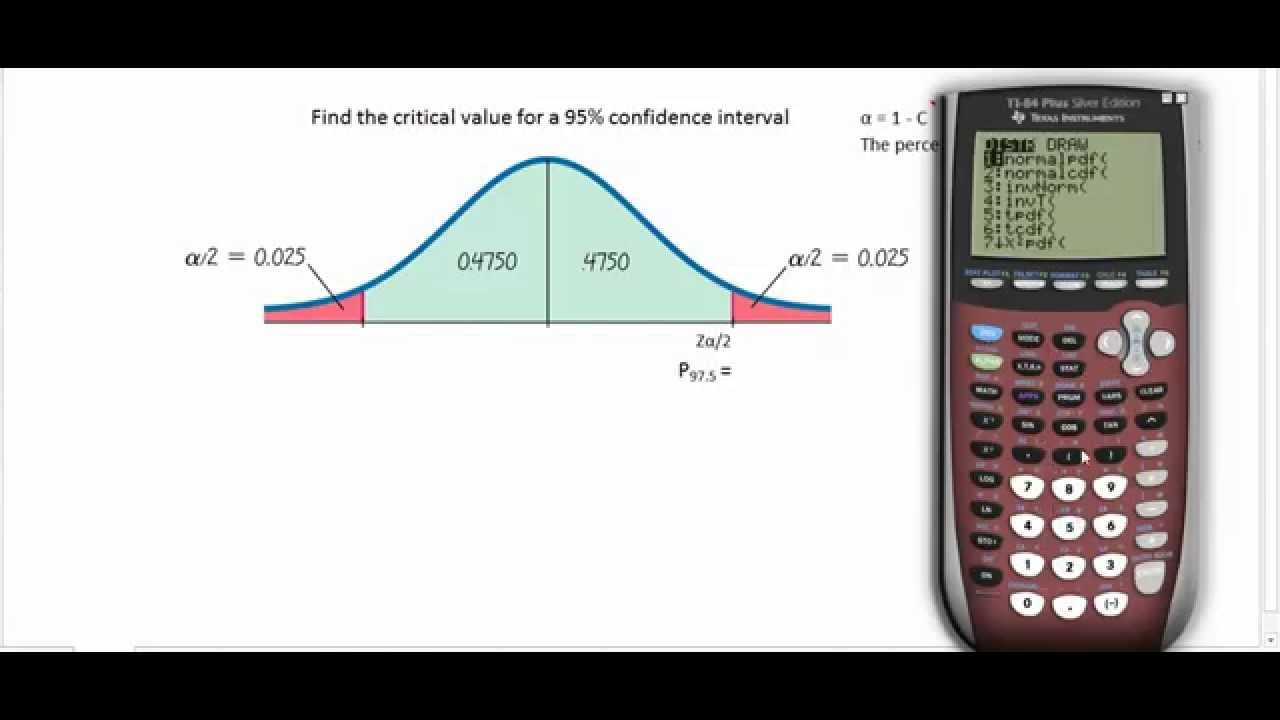
Finding Z Critical Values for a Given Confidence Level using the TI84
Probabilities in a Normal Distribution - TI-84
TI84 Plus CE Range, Variance and Standard Deviation
TI-84 Plus: Find the Mean, Median, and Mode
5.0 / 5 (0 votes)
Thanks for rating: