TI-84 Plus: Find the Mean, Median, and Mode
TLDRThis tutorial video guides viewers on calculating statistical measures like mean, median, and mode using a TI-84 Plus CE or similar graphing calculator. The video demonstrates how to input data into list L1, clear lists, and use the calculator's '1-Var Stats' function to find the mean, variance, count, min, max, and quartiles. It also explains how to find the mode by sorting the data in ascending order to identify the most frequently occurring value. For datasets with frequency lists, the video shows how to input and analyze data to determine statistical measures, ensuring users can handle both simple and frequency-based datasets effectively.
Takeaways
- 📚 The tutorial is focused on teaching how to calculate statistical measures like mean, median, and mode using a TI-84 Plus ZE graphing calculator.
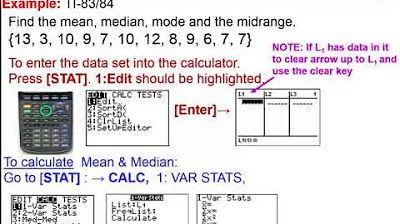
- 🔍 To begin, press the 'STAT' button and select 'Edit' to input data into a list, such as L1.
- ⚠️ Ensure that L1 and L2 lists are available or use 'Setup Editor' under '2nd' then 'STAT' to create them if they are missing.
- 🗑️ Clear any existing values in the list by pressing the 'up arrow', selecting the list name, pressing 'Clear', and hitting 'Enter'.
- 📝 Input the data set values into L1, for example, the values 7, 5, 2, 7, 6, 12, 10, 4, 8, 9, and 7.
- ✅ Use '2nd' and 'Mode' (which is 'Quit') to exit the list editing mode.
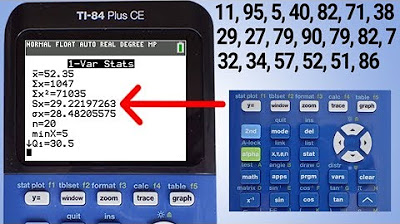
- 🔢 To calculate mean, median, mode, and other statistics, go to 'STAT', then 'Calc', and select '1-Var Stats'.
- 📋 Enter the list name where the values are stored, for instance, L1, and ensure the correct list is referenced.
- 📊 The calculator will provide various statistical measures, but it does not directly give the mode.
- 🔄 To find the mode, sort the list in ascending order using 'Sort Ascending' under 'Edit'.
- 👀 After sorting, visually identify the number that appears most frequently to determine the mode.
- 📈 For data sets with frequency lists, input the values into L1 and the frequency counts into L2, then calculate the statistics using '1-Var Stats' with the frequency list specified.
Q & A
What is the purpose of the tutorial in the transcript?
-The purpose of the tutorial is to teach viewers how to calculate the mean, median, mode, and other statistical values of a dataset using a TI-84 Plus ZE or any other TI-84 Plus graphing calculator.
How does one begin to calculate statistical values on a TI-84 Plus calculator?
-To begin, one should press the 'STAT' button and then the 'EDIT' option to enter their data into a list, typically L1 or L2.
What should you do if L1 or L2 is not available on your calculator?
-If L1 or L2 is not available, you can access them by pressing '2ND', then 'STAT', and selecting the 'Setup Editor' option.
How do you clear existing values from a list on the calculator?
-To clear existing values, press the 'up arrow' key to select the list name, press 'CLEAR', and then hit 'Enter'.
What is the process to find the mean, median, and mode after entering the data?
-After entering the data, press 'STAT' again, then use the right arrow key to go to 'CALC', and select '1-Var Stats' to calculate the mean, median, and mode.
Why might the calculator not display the mode in the '1-Var Stats' calculation?
-The calculator may not display the mode because it is not directly calculated by the '1-Var Stats' function. Instead, one can sort the list to identify the mode manually.
How can you sort the data list to find the mode?
-To sort the data list, go back to 'STAT', then 'EDIT', and use the 'Sort Ascending' option to arrange the values in ascending order, making it easier to spot the mode.
What is a frequency list and how does it differ from a regular data list?
-A frequency list is a list that contains the number of times each value occurs in the dataset. It differs from a regular data list, which is just a list of numbers without indicating how often each number appears.
How do you handle a dataset with a frequency list on the TI-84 Plus calculator?
-For a dataset with a frequency list, after entering the values into L1 and the frequencies into L2, use 'STAT', 'CALC', and '1-Var Stats', making sure to select the correct list names for both values and frequencies.
What happens if you have already entered values into a different list on the calculator?
-If values are entered into a different list, you should ensure to type the correct list name when using the '1-Var Stats' function to calculate the statistical values.
How can you exit the data entry or editing mode on the calculator?
-To exit the data entry or editing mode, press '2ND' followed by the 'MODE' key, which is labeled as 'QUIT'.
Outlines
📚 Introduction to Calculating Mean, Median, Mode on TI-84 Plus
This paragraph introduces a tutorial on calculating statistical measures like mean, median, and mode using a TI-84 Plus graphing calculator. The speaker provides a step-by-step guide on how to input data into list L1 and how to navigate the calculator's STAT menu to perform calculations. It also addresses common issues such as missing list names and pre-existing values in the list, with solutions like using the setup editor and clearing lists.
🔍 Finding Mean, Median, and Mode Using TI-84 Plus
The speaker explains how to calculate the mean, median, and mode for a data set on the TI-84 Plus calculator. They guide through the process of entering data into list L1, exiting the edit mode, and then accessing the calculator's 1-Var Stats function to find the mean, sum, variance, number of values, minimum, maximum, and quartiles. The mode is not directly provided, but the speaker suggests sorting the list in ascending order to identify the mode by observing the most frequently occurring value.
📝 Sorting Data to Determine the Mode
In this section, the tutorial demonstrates how to sort the data in list L1 in ascending order to find the mode. The speaker explains that after sorting, one can easily identify the mode by looking for the value that appears most frequently. The example given shows that the number 7 appears three times consecutively, indicating it is the mode of the data set.
📉 Calculating Statistics with Frequency Lists
The final part of the tutorial covers how to calculate statistics when there is a frequency list available. The speaker instructs the user to clear any existing data in list L1, input new values, and then enter the frequency of each value into list L2. They then show how to use the 1-Var Stats function with both the value list (L1) and the frequency list (L2) to obtain the required statistics. The tutorial concludes with a reminder to like the video if it was helpful.
Mindmap
Keywords
💡TI-84 Plus ZE
💡Mean
💡Median
💡Mode
💡Data Set
💡Stat Button
💡List Editor
💡Frequency List
💡Sort Ascending
💡1-Var Stats
Highlights
Introduction to a quick tutorial on calculating mean, median, mode, and other values on a TI-84 Plus graphing calculator.
Explanation of how to access the 'Edit' option to input data lists on the calculator.
Instructions for creating list names L1 and L2 if they are not present.
Guidance on clearing existing values from lists using the up arrow key and clear option.
Demonstration of entering values into L1 for the purpose of the tutorial.
Exiting the list editing mode using the '2nd' and 'Mode' keys.
Navigating to the 'Calc' menu to perform 1-var stats calculations.
Details on entering the correct list name for calculations and how to type it using calculator keys.
Clarification on the absence of a frequency list in the first example.
Process of calculating mean, sum, variance, number of values, minimum, maximum, and quartiles.
Explanation of the absence of mode in the calculator's output and a workaround to find it.
Sorting the list in ascending order to identify the mode by observing repeated values.
Identification of the mode (7) in the dataset as it appears most frequently.
Instructions for clearing L1 and entering new values for a different example.
Entering frequency values into L2 for the second example with a frequency list.
Repeating the 1-var stats calculation with the new list and frequency list.
Final statistics for the second example with a frequency list.
Closing remarks and an invitation to like the video for more tutorials.
Transcripts
Browse More Related Video

TI 84 Plus CE Mean Median Mode Range

Mean, Variance, and Standard Deviation of Discrete Random Variable-TI-84

Calculating The Standard Deviation, Mean, Median, Mode, Range, & Variance Using Excel

TI-84 Plus Graphing Calculator Guide: Statistics

TI84 Plus CE Range, Variance and Standard Deviation

Elementary Statistics - Chapter 3 Describing Exploring Comparing Data Measure of Central Tendency
5.0 / 5 (0 votes)
Thanks for rating: