TI84 Plus CE Range, Variance and Standard Deviation
TLDRThis tutorial demonstrates how to calculate the range, variance, and standard deviation of a dataset using a TI 84 Plus CE Graphing Calculator. The video guides viewers through entering 20 numbers into a list, finding the maximum and minimum values to determine the range, and using the calculator's built-in functions to compute the standard deviation and variance. It concludes with suggestions for related videos on programming the calculator and calculating mean, median, and mode, encouraging viewers to subscribe and like the content.
Takeaways
- 📚 The video is a tutorial on how to calculate range, variance, and standard deviation using a TI 84 Plus CE Graphing Calculator.
- 🔢 The process involves a set of 20 numbers that are entered into a list on the calculator.
- 📝 The user is guided to clear any previous data from the L1 list before entering the new set of numbers.
- 🔑 To enter numbers, each number is typed followed by pressing the enter button.
- 🔍 The range is found by calculating the difference between the maximum and minimum values in the data set.
- 📈 The maximum value in the data set is identified as 95 using the calculator's max function.
- 📉 The minimum value, which is 5, is found using the calculator's min function.
- 🧮 The range is calculated to be 90 by subtracting the minimum value from the maximum.
- 📊 To find variance and standard deviation, the user is directed to the calculator's one-variable statistics function.
- 📐 The standard deviation for the data set is given as 29.22.
- 🔢 The variance is obtained by squaring the standard deviation, or by using the calculator's variance function.
- 📚 Additional resources are offered for learning more about the TI 84 Plus CE, including programming for the quadratic formula and calculating mean, median, and mode.
Q & A
What is the main topic of the video script?
-The main topic of the video script is how to calculate the range, variance, and standard deviation of a set of numbers using a TI 84 Plus CE Graphing Calculator.
How many numbers are in the set provided in the script?
-There are 20 numbers in the set provided in the script.
What is the first step in entering numbers into the calculator?
-The first step is to press the stat button and choose number 1, Edit, to access the list where the numbers will be entered.
How do you clear the L1 list for a new set of numbers?
-To clear the L1 list, move the cursor to highlight L1, press the clear button, and then the down arrow button.
What is the range of the data set in the script?
-The range of the data set is 90, calculated by subtracting the smallest number (5) from the largest number (95).
How do you find the maximum value in the data set using the calculator?
-To find the maximum value, press the 2nd button, then the list button, move to the Math tab, select max, enter L1, and press enter.
What is the standard deviation of the numbers in L1 according to the script?
-The standard deviation of the numbers in L1 is 29.22.
How is the variance related to the standard deviation?
-The variance is the square of the standard deviation. To find the variance, square the value of the standard deviation.
What is the process to calculate variance using the calculator as per the script?
-To calculate variance, press the 2nd button and the list button, go to the Math tab, highlight variance, enter L1, close the parentheses, and press enter.
What additional resources are mentioned in the script for further learning?
-The script mentions videos on programming the TI 84 Plus CE for the quadratic formula and calculating the mean, median, and mode of a group of numbers.
How can viewers support the video if they find it helpful?
-Viewers can support the video by giving it a thumbs up and subscribing to the channel.
Outlines
📊 Introduction to Calculating Statistics with TI 84 Plus CE
In this section, Rob introduces the video topic: calculating the range, variance, and standard deviation of a set of 20 numbers using the TI 84 Plus CE Graphing Calculator. He begins by guiding the viewer on entering the numbers into the list by pressing the stat button and choosing the edit option.
🧹 Clearing Previous Data from Lists
Rob explains how to clear any previous data from the L1 list on the calculator. He highlights the L1 list, presses the clear button, and uses the down arrow to remove the old numbers, preparing for the new data entry.
🔢 Entering Numbers into the L1 List
This part details how to enter the 20 numbers into the L1 list. Each number is typed in and followed by pressing the enter button. Rob demonstrates this process until the entire list is populated with the data.
🔍 Calculating the Range
Rob describes the steps to calculate the range. After entering the numbers, he exits the list and returns to the home screen. Using the list and math functions, he finds the maximum (95) and minimum (5) values in the data set, then calculates the range as 90 by subtracting the minimum from the maximum.
📈 Finding Variance and Standard Deviation
Here, Rob walks through the process of calculating the variance and standard deviation. By accessing the '1-Var Stats' under the Calc tab and ensuring L1 is selected, he finds the standard deviation (approximately 29.22). He explains that the variance can be found by squaring the standard deviation or directly using the calculator's functions.
🎥 Conclusion and Additional Resources
Rob wraps up the video by mentioning additional resources. He suggests other tutorial videos on programming the TI 84 Plus CE for the quadratic formula and calculating the mean, median, and mode. He encourages viewers to like the video and subscribe to the channel.
Mindmap
Keywords
💡Range
💡Variance
💡Standard Deviation
💡TI 84 Plus CE Graphing Calculator
💡List
💡Edit
💡Max and Min
💡Stat Button
💡Calc Tab
💡One-variable Stats
💡Quadratic Formula
Highlights
Introduction to calculating range, variance, and standard deviation using the TI 84 Plus CE Graphing Calculator.
Instructions on entering numbers into a list on the calculator.
How to clear a list for new data entry.
Entering 20 numbers into the L1 list for analysis.
Exiting the list and navigating to the calculator's home screen.
Accessing the Math tab to calculate the maximum value in the data set.
Finding the largest number, 95, in the L1 data set.
Method to find the minimum value in the data set using the calculator.
Identifying the lowest number, 5, in the data set.
Explanation of calculating the range by subtracting the minimum from the maximum value.
Calculating the range as 90 for the given data set.
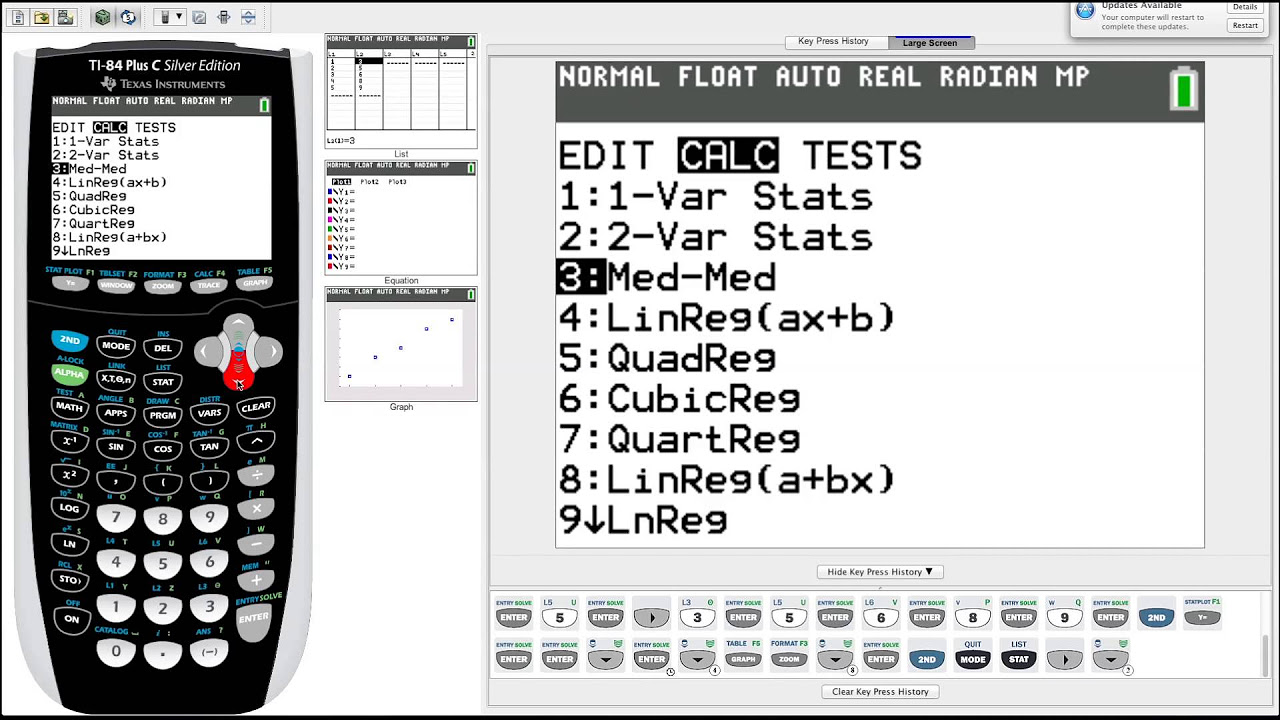
Navigating to the Calc tab to find variance and standard deviation.
Selecting one variable stats for further calculations.
Entering L1 in the List field for statistical calculations.
Displaying the standard deviation of the L1 list as 29.22.
Understanding that variance is the square of the standard deviation.
Alternative method to find variance using the calculator's Math tab.
Final display of the variance for the L1 data set.
Recommendation of additional videos on programming the TI 84 Plus CE and calculating mean, median, and mode.
Encouragement for viewers to like, subscribe, and engage with the channel.
Transcripts
Browse More Related Video

TI 84 Plus CE Mean Median Mode Range
TI-84 Plus Graphing Calculator Guide: Statistics
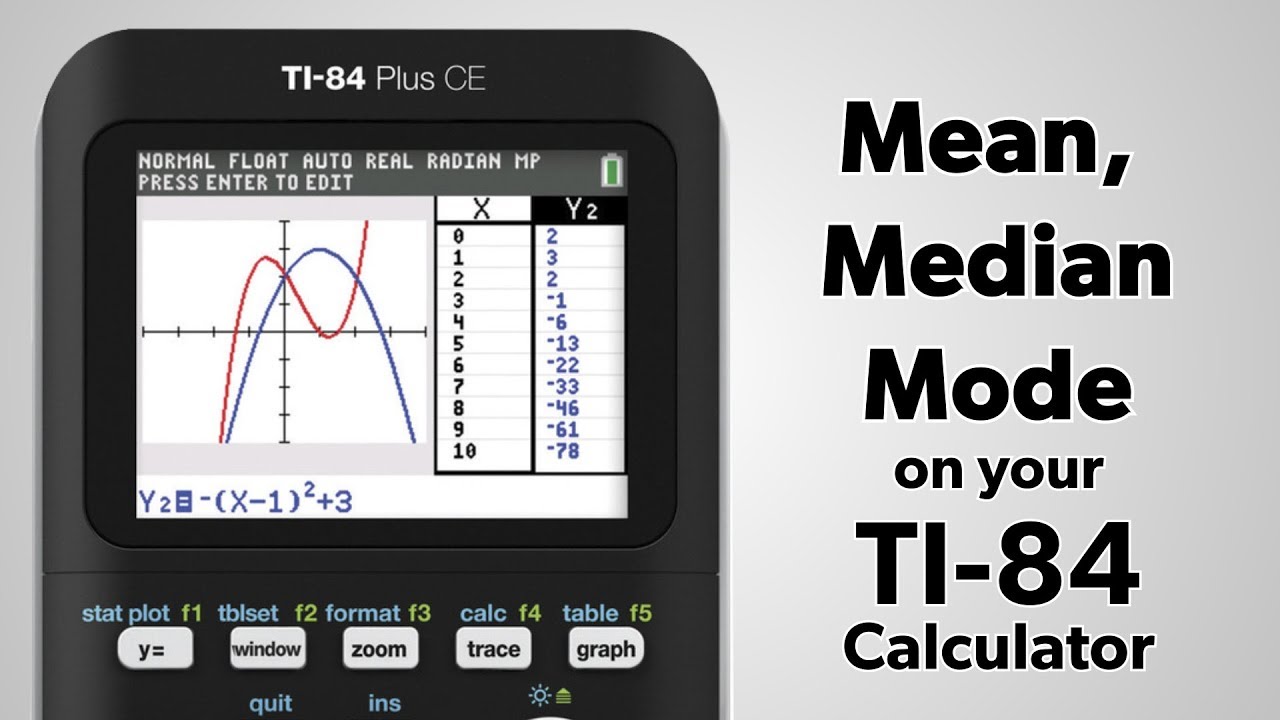
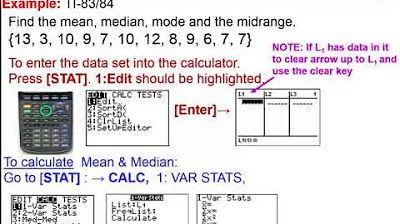
TI-84 Plus: Find the Mean, Median, and Mode
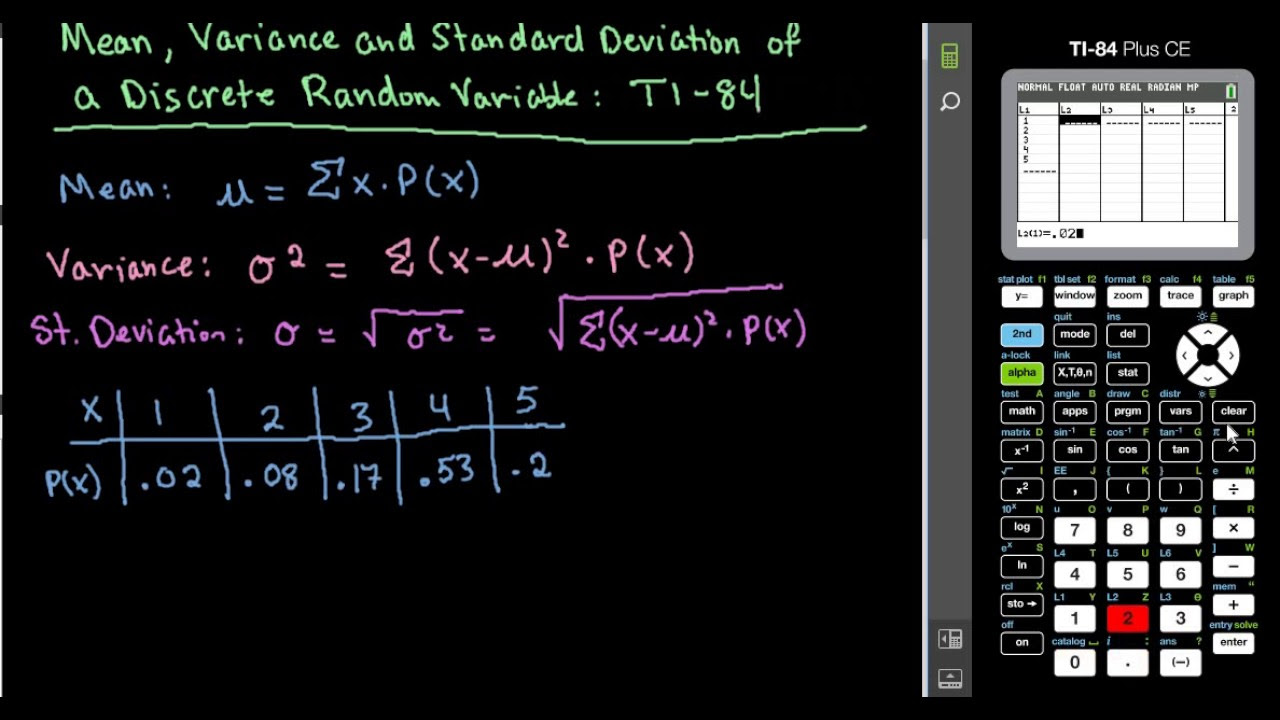
Mean, Variance, and Standard Deviation of Discrete Random Variable-TI-84

Math 119 Chapter 3 part 2
Elementary Statistics - Chapter 3 Describing Exploring Comparing Data Measure of Central Tendency
5.0 / 5 (0 votes)
Thanks for rating: