Solving Quadratic Equations with a TI-Graphing Calculator
TLDRThis video tutorial demonstrates how to solve quadratic equations using a graphing calculator without factoring or the quadratic formula. It focuses on identifying the solutions where the graph intersects the x-axis, showcasing step-by-step calculator navigation to find the x-intercepts. The presenter guides viewers through various examples, emphasizing the importance of adjusting the calculator's window settings for optimal visualization and accuracy in finding the roots of the parabola.
Takeaways
- 📚 The video focuses on solving quadratic equations using a graphing calculator rather than traditional methods like factoring or the quadratic formula.
- 📈 The solutions to quadratic equations are found at the points where the graph of the equation crosses the x-axis.
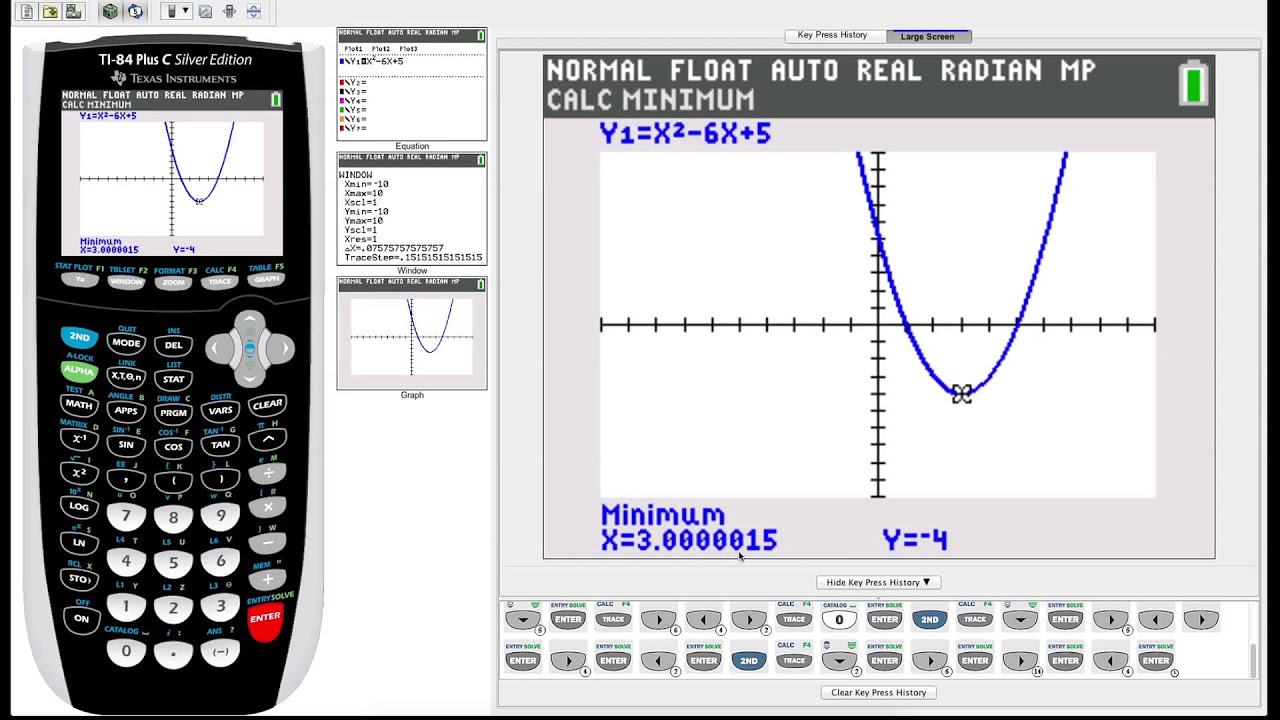
- 🔍 The graphing calculator is used to visualize the parabola and identify the x-intercepts, which are the solutions to the quadratic equation.
- 📝 The first example demonstrates solving x^2 - x - 6 = 0, showing the process of finding two distinct x-intercepts using the calculator's TRACE function.
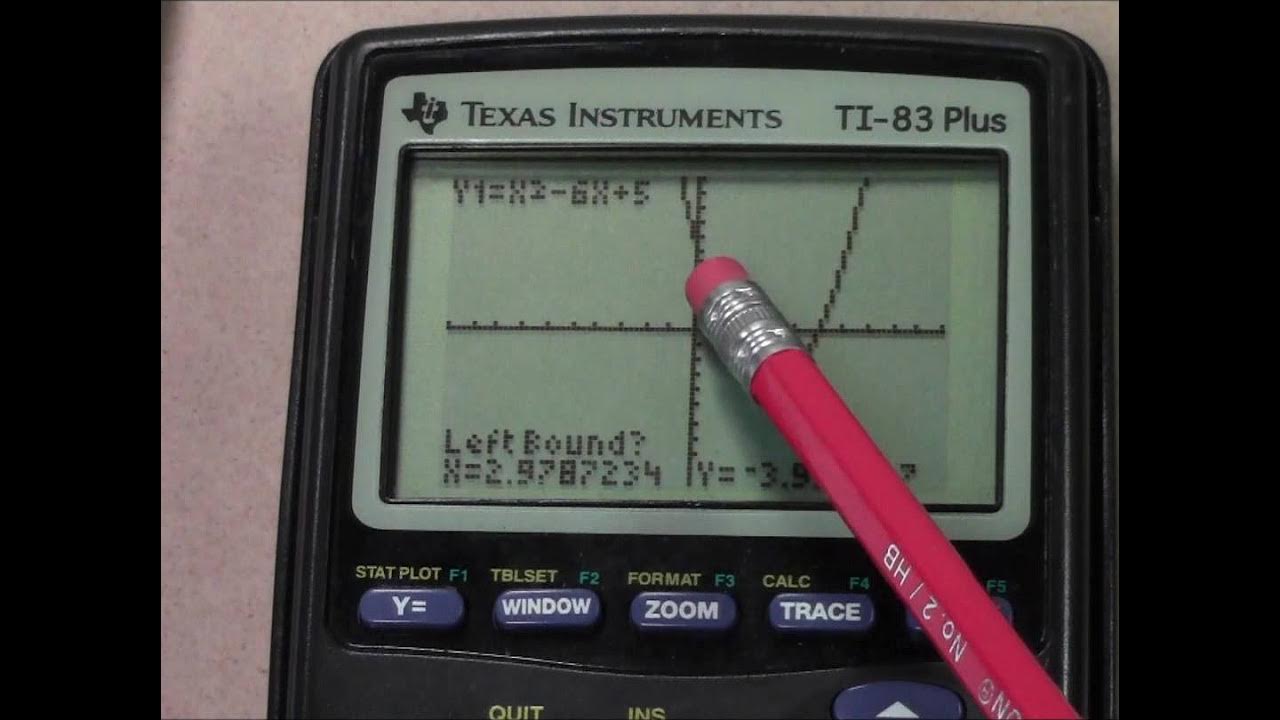
- 👉 The TRACE function's zero option is utilized to find the x-intercepts by providing a left-hand bound, a right-hand bound, and a guess close to the actual solution.
- 🔢 The process involves adjusting the calculator's window settings to better visualize the x-intercepts and ensure accurate readings.
- 📉 The video also addresses different types of quadratic equations, including those that do not cross the x-axis, touch it, or are flipped due to a negative leading coefficient.
- 🛠️ Additional calculator functions such as 'vars' and 'table' are mentioned as alternative methods to verify the solutions by evaluating the function at specific x-values.
- 📊 The table feature of the calculator is used to find x-values where the function equals zero, which corresponds to the x-intercepts.
- 🔧 The importance of adjusting the calculator's zoom and window settings is highlighted to accommodate various parabola shapes and positions.
- ✍️ The video concludes with a challenge for viewers to attempt solving a quadratic equation on their own using the demonstrated graphing calculator techniques.
Q & A
What is the primary focus of the video?
-The video focuses on demonstrating how to solve quadratic equations using a graphing calculator, specifically by finding the points where the graph crosses the x-axis.
Why does the video not cover factoring or the quadratic formula?
-The video does not cover factoring or the quadratic formula because these topics were already discussed in a previous video, which is linked in the description.
What is the significance of the x-axis in the context of this video?
-The x-axis is significant because the solutions to the quadratic equations are found where the graph of the equation crosses the x-axis, also known as the x-intercepts.
How does the video demonstrate finding the first solution to a quadratic equation using a graphing calculator?
-The video demonstrates finding the first solution by using the 'second trace' and 'zero' options on the calculator to identify where the graph crosses the x-axis from negative to positive values.
What does the term 'left hand bound' refer to in the context of the calculator's zero function?
-The 'left hand bound' refers to the position of the cursor to the left of the solution on the graph, which helps the calculator to start searching for the x-intercept in the correct area.
How does the video suggest finding the second solution to a quadratic equation after finding the first one?
-The video suggests repeating the steps used to find the first solution, adjusting the cursor to the left of the second x-intercept and using the 'second trace' and 'zero' options again.
What is the purpose of adjusting the zoom level and window on the graphing calculator?
-Adjusting the zoom level and window helps to get a clearer view of the graph, especially the x-intercepts, making it easier to identify the solutions to the quadratic equations.
Why might the video suggest changing the X minimum and maximum values on the calculator?
-Changing the X minimum and maximum values can help to better frame the graph, particularly for parabolas that are far from the origin or have a wide range of x-values.
What alternative methods does the video mention for verifying the solutions found using the graphing calculator?
-The video mentions using the 'vars' function to evaluate the quadratic equation at specific x-values, and checking the table of values to see when y equals zero.
How does the video handle a quadratic equation that does not cross the x-axis?
-The video does not explicitly address this in the provided script, but it mentions parabolas that are flipped over, suggesting that for such equations, the graphing calculator would show no x-intercepts.
What is the final step the video demonstrates for solving a quadratic equation using a graphing calculator?
-The final step demonstrated in the video is using the 'second trace' and 'zero' options to find the x-values where the graph of the quadratic equation touches the x-axis, indicating the solutions.
Outlines
📚 Introduction to Solving Quadratics with a Graphing Calculator
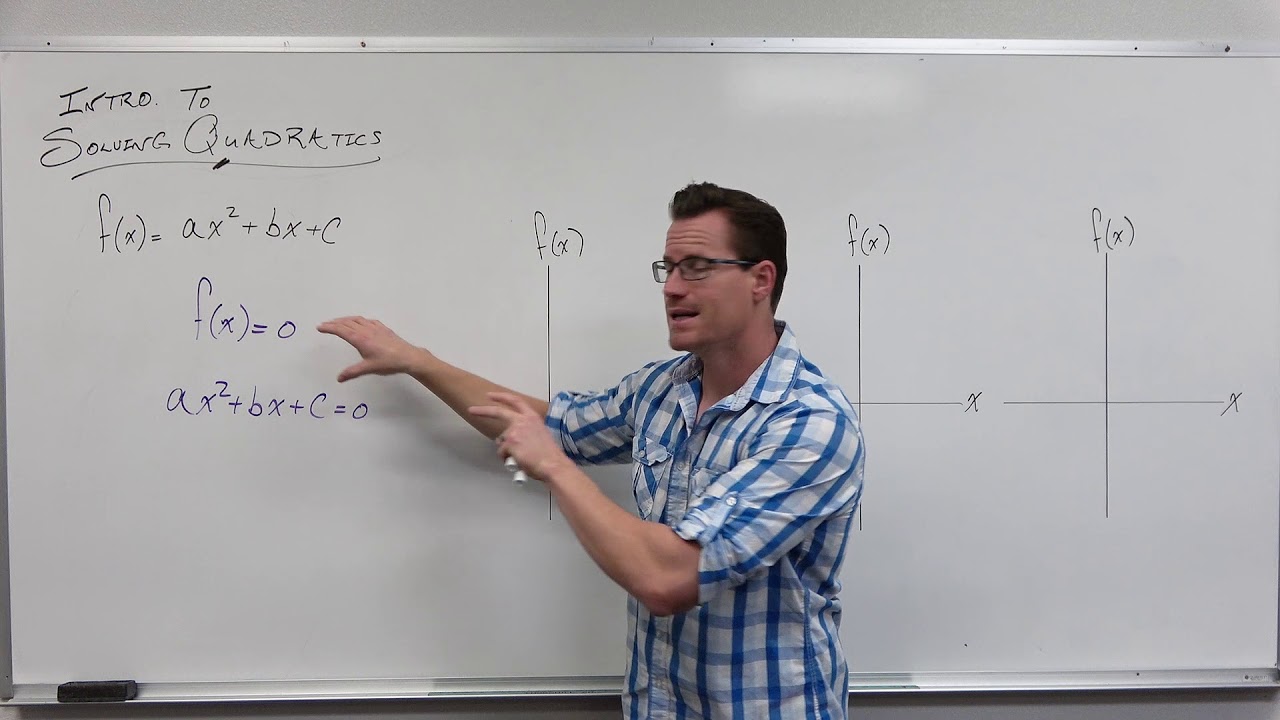
This paragraph introduces the process of solving quadratic equations using a graphing calculator. The speaker clarifies that they will not delve into factoring or the quadratic formula, which were covered in a previous video, but will focus on the steps to find the solutions using a graphing calculator. The solutions are identified as the points where the graph of the quadratic equation crosses the x-axis. The example provided is the quadratic equation x^2 - x - 6 = 0, which crosses the x-axis twice, indicating two solutions. The speaker guides the viewer through entering the function into the calculator and using the 'Trace' and 'Zero' features to find the solutions.
🔍 Locating the X-Intercepts Using the Calculator
The speaker continues to demonstrate how to use the graphing calculator to find the x-intercepts of a parabola, which are the solutions to the quadratic equation. They explain the process of adjusting the calculator's window to better view the x-intercepts and using the 'Trace' and 'Zero' functions to identify the points where the graph crosses the x-axis. The speaker also discusses different types of quadratic equations, such as those that do not cross the x-axis, touch and bounce back, or are flipped over due to a negative leading coefficient. The paragraph concludes with the speaker finding the first solution to the example equation, x = -2.
📉 Adjusting the Graphing Window for Accurate Solutions
In this paragraph, the speaker discusses the importance of adjusting the graphing window on the calculator to accurately identify the x-intercepts. They provide a step-by-step guide on how to zoom in and out, and how to change the x and y minimum and maximum values to get a clear view of the graph. The speaker then applies these techniques to find the second solution to the example quadratic equation, x = 3, and mentions alternative methods to verify the solutions, such as using the 'vars' function or the table feature on the calculator.
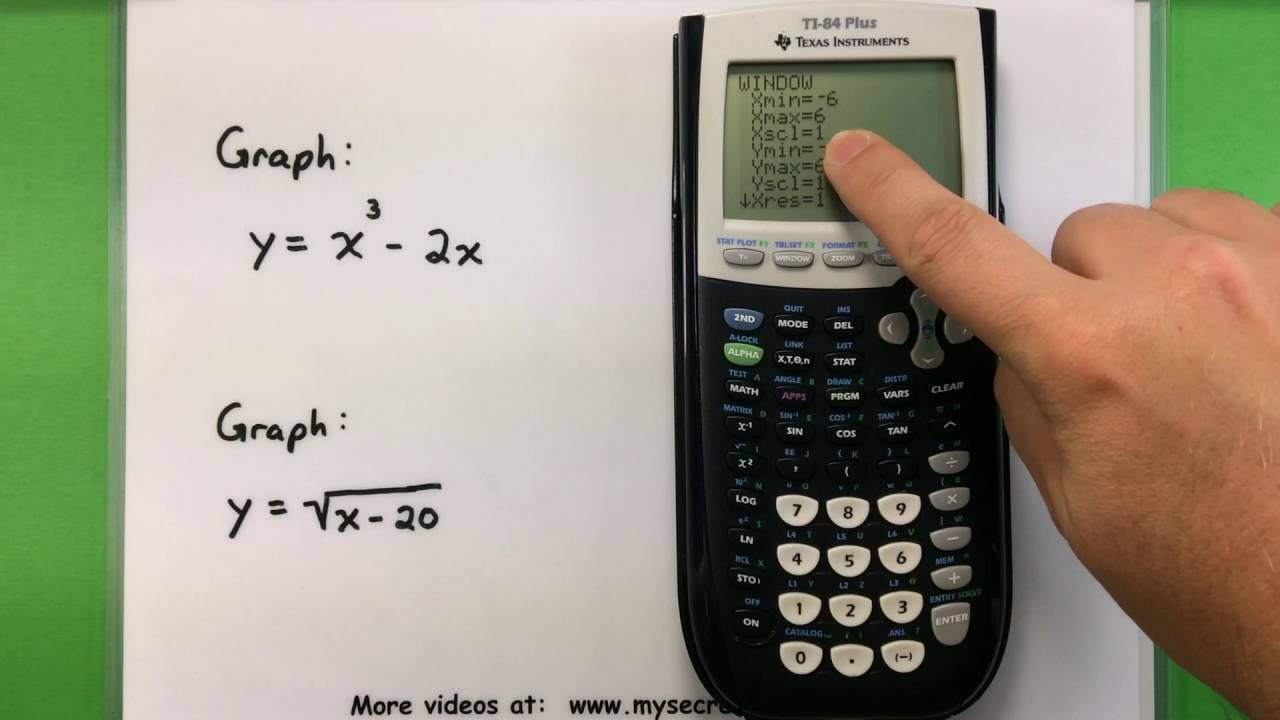
🔢 Solving Additional Quadratics and Verifying Solutions
The final paragraph covers solving additional quadratic equations using the graphing calculator. The speaker provides examples of different forms of quadratic equations and demonstrates how to rearrange terms to fit the calculator's input format. They show how to use the 'Trace' and 'Zero' functions to find the x-intercepts for each equation and verify the solutions using the calculator's 'vars' function and table feature. The speaker also encourages the viewer to try solving a quadratic equation on their own, providing a final example with the equation 2x² + 37x - 51, and explaining how to adjust the graphing window for a better view of the solutions.
Mindmap
Keywords
💡Quadratic Equations
💡Graphing Calculator
💡X-Axis
💡Parabola
💡Zero or Root
💡Second Trace
💡Left Hand Bound and Right Hand Bound
💡Zoom Standard
💡X-Intercept
💡Factoring
💡Quadratic Formula
Highlights
Introduction to solving quadratic equations using a graphing calculator without factoring or the quadratic formula.
Explanation of how the solutions to quadratics are found where the graph crosses the x-axis.
Demonstration of entering the quadratic equation x^2 - x - 6 = 0 into a graphing calculator.
Use of the standard zoom (Zoom six) to visualize the parabola and its x-axis intersections.
Step-by-step guide on using the second Trace and zero options to find the first solution.
Method of providing a window for the calculator to find the x-intercept by adjusting left and right bounds.
First solution identified as x = -2 for the equation x^2 - x - 6 = 0.
Repeating the process to find the second solution for the same quadratic equation.
Second solution found as x = 3, completing the solutions for the given quadratic.
Alternative method of solving quadratics using factoring or the quadratic formula mentioned.
Instructions for solving a new quadratic equation, 5x^2 + 14x - 3 = 0, using the graphing calculator.
Adjusting the graphing window to better visualize the x-intercepts for the equation.
Finding the first solution x = -3 and the second solution x = 1/5 for the equation 5x^2 + 14x - 3 = 0.
Additional ways to check solutions using the calculator's home screen and variables function.
Using the table feature on the calculator to verify the x-intercepts.
Solving a misformatted quadratic equation by rearranging terms and solving with the calculator.
Finding solutions x = 0.4 (2/5) and x = -2/5 for the rearranged quadratic equation.
Final example of solving a parabola that is upside down with a negative leading coefficient.
Adjusting the graphing window extensively to find the x-intercepts for the final quadratic equation.
Solutions for the final equation identified as x = -1.5 and x = 17.
Summary of the process for solving quadratics with graphing calculators and encouragement to practice.
Transcripts
Browse More Related Video
TI-84 Plus Graphing Calculator Guide: Graphing functions
Basic Math - Graphing with a Ti-83 or Ti-84 Calculator
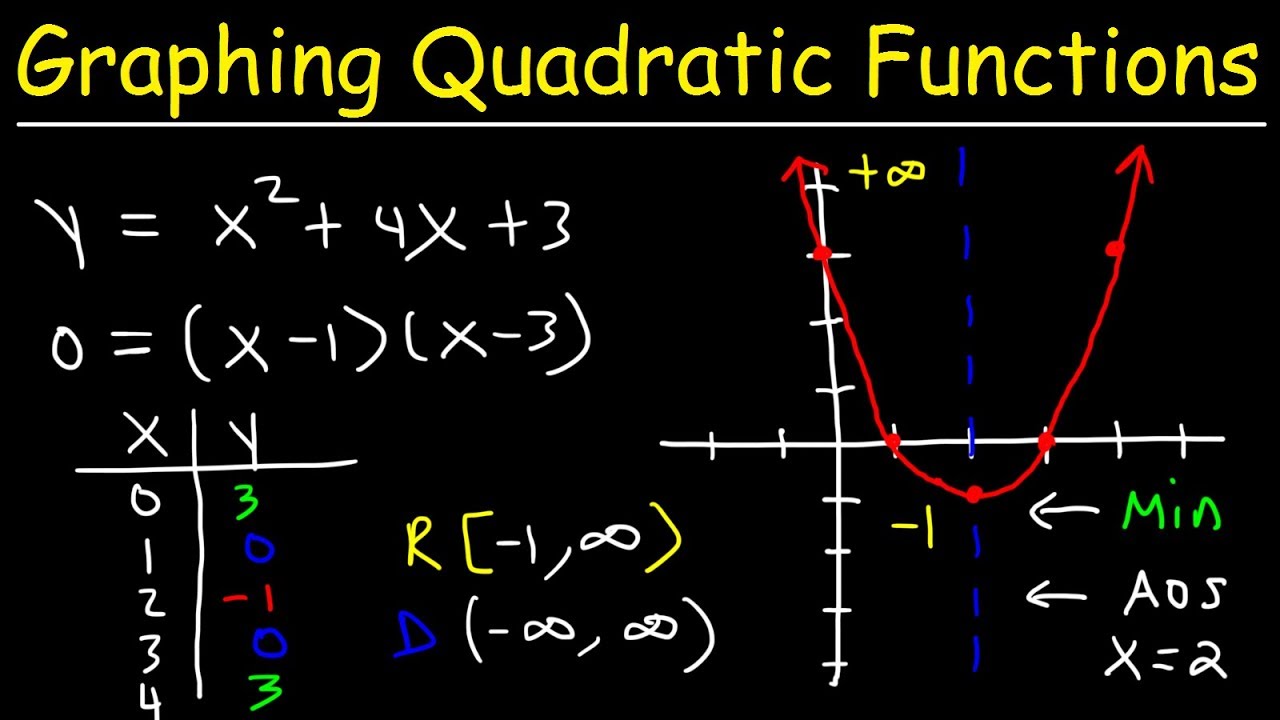
Graphing Quadratic Functions In Standard Form Using X & Y Intercepts | Algebra
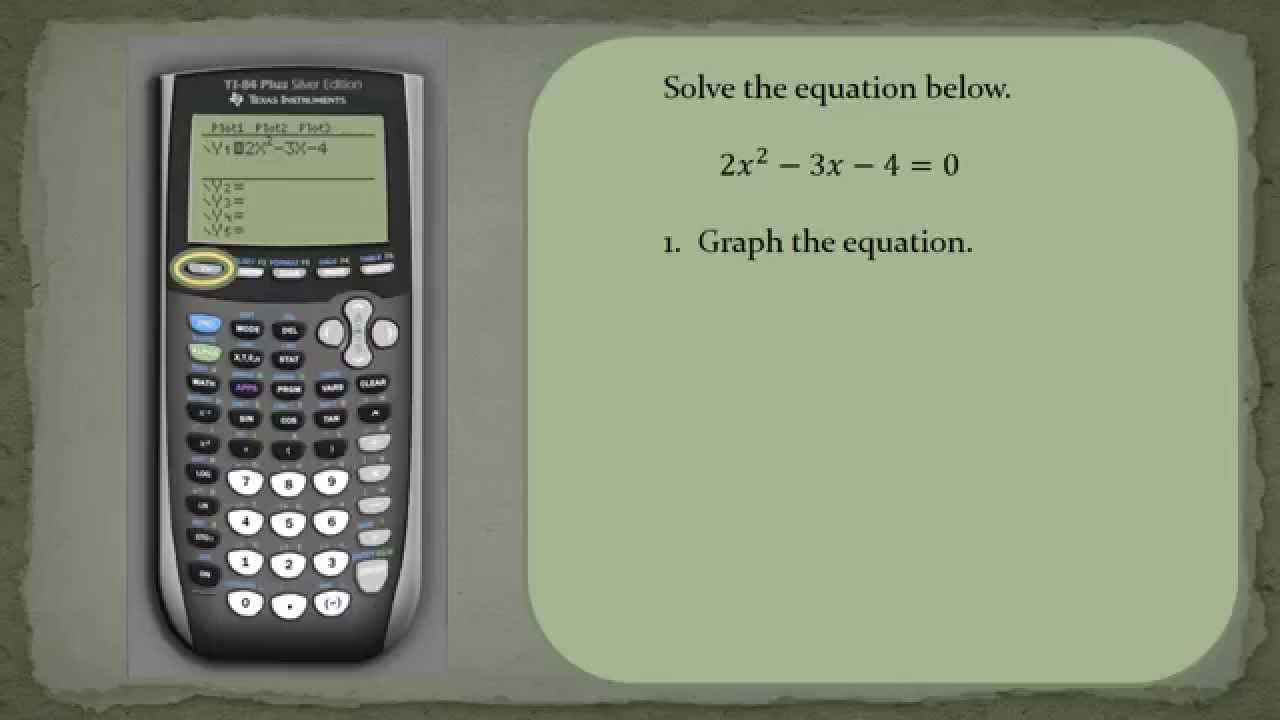
How to Solve a Quadratic Equation Using a Ti84
Introduction to Solving Quadratics (Precalculus - College Algebra 16)
Quadratic Equations using a TI 83 Plus Graphing Calculator
5.0 / 5 (0 votes)
Thanks for rating: