Basic Math - Graphing with a Ti-83 or Ti-84 Calculator
TLDRThis video tutorial offers a step-by-step guide on how to use a TI-83 or 84 calculator for basic graphing. It starts with entering equations on the 'y=' screen, then guides through adjusting window settings to optimize graph visibility. The video demonstrates how to graph equations like 'y = x^3 - 2x' and 'y = sqrt(x - 20)', adjusting the window size to accommodate different graphs. It also covers using the trace feature for evaluating specific points on the graph, providing a hands-on approach to understanding graphing calculator functions and enhancing mathematical visualization.
Takeaways
- 📚 Start by turning on the TI-83 or 84 calculator and navigating to the 'y=' screen to enter equations.
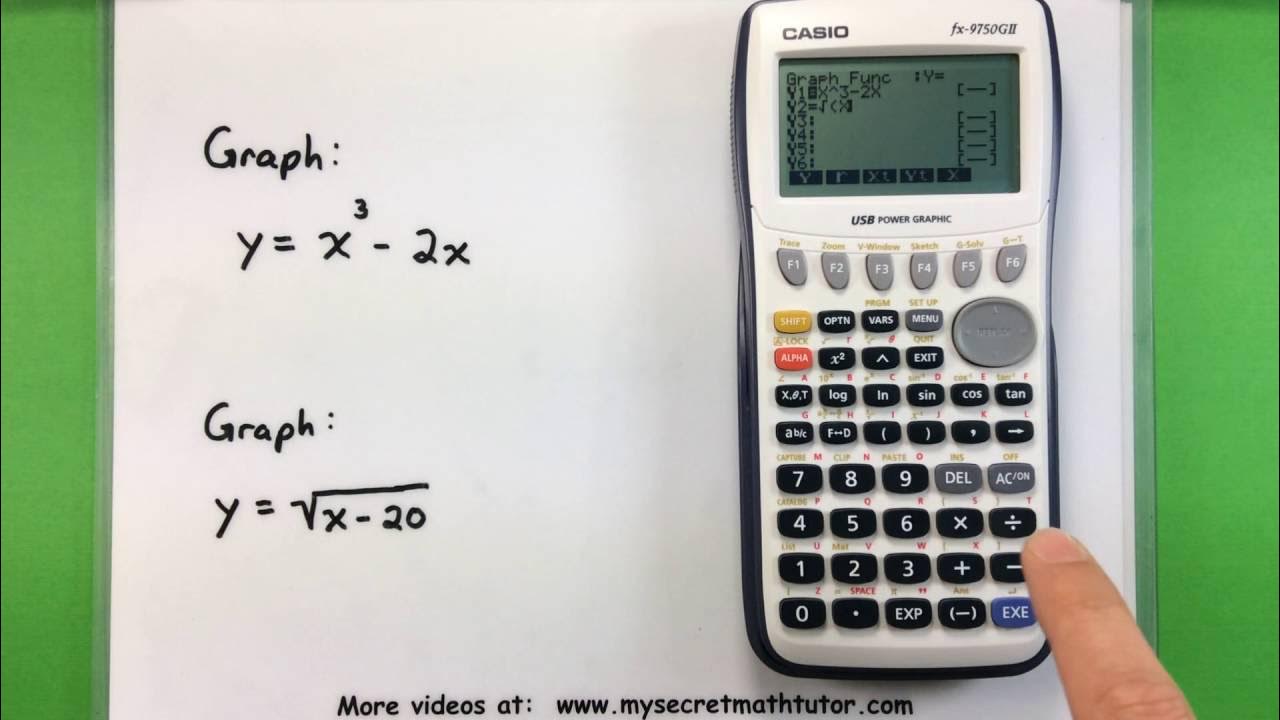
- 🔍 Use the 'y=' screen to input equations, such as 'x^3 - 2x', using the calculator's variable and function keys.
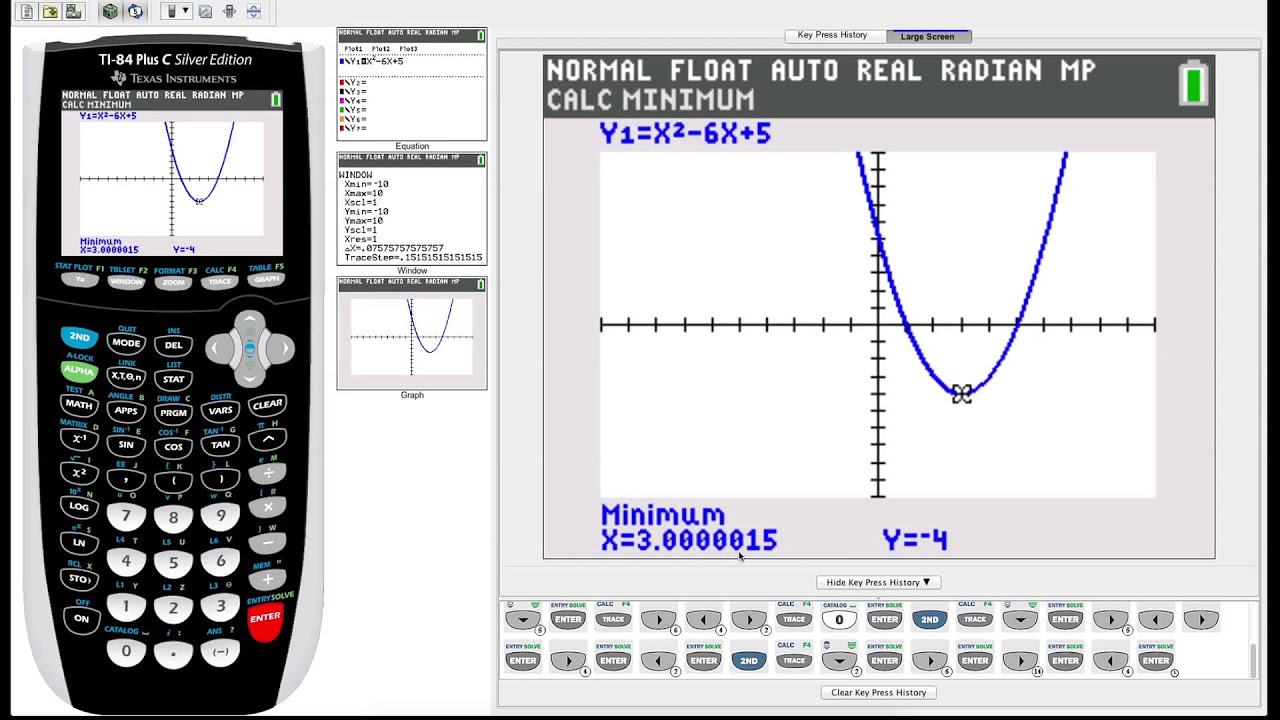
- 📐 Adjust the window settings to optimize the graph's view, including setting the Xmin, Xmax, Ymin, and Ymax.
- 📊 Shrink the window size to focus on specific areas of the graph, such as setting X values between -6 and 6 and Y values between -6 and 6.
- 📈 Use the graph button to visualize the equation you've entered, waiting a few seconds for the calculator to draw the graph.
- 🔄 Enter multiple equations on the 'y=' screen and adjust the window settings to accommodate all graphs for comparison.
- 👀 Use the trace feature to evaluate specific points on the graph by moving a cursor with arrow keys or entering exact x-values.
- ✅ The trace feature provides the exact coordinates (x, y) of points on the graph, aiding in the evaluation of specific x-values.
- 🛠️ Clear individual equations or toggle them on and off using the clear button or by highlighting the 'y=' and pressing enter.
- 🔧 Customize the graphing experience by adjusting the X and Y scale to change the granularity of the graph's tick marks.
- 🌐 For more tutorials and information, visit the website mysecretmathtutor.com.
Q & A
What is the main topic of the video?
-The main topic of the video is how to use a TI-83 or TI-84 calculator for basic graphing, including entering equations, adjusting window size, and using trace features.
How do you access the 'y=' screen on a TI calculator?
-To access the 'y=' screen on a TI calculator, you press the left button that says 'y=' from the home screen.
What does the 'y1', 'y2', 'y3' labeling represent on the calculator?
-The 'y1', 'y2', 'y3' labeling represents different equations that can be stored and graphed on the calculator.
How do you enter the variable 'x' raised to the power of 3 on the calculator?
-To enter 'x' raised to the power of 3, you press the button with 'x^3' or 'carrot 3' on it.
What is the purpose of adjusting the window size before graphing?
-Adjusting the window size before graphing helps to ensure that the graph is displayed in an optimal view, showing all the necessary details of the graph.
What are the default settings for X min, X max, Y min, and Y max on the calculator's graphing window?
-The default settings for X min and X max, as well as Y min and Y max, are usually set between -10 and 10.
How do you change the X scale and Y scale on the calculator?
-The X scale and Y scale can be adjusted in the 'window' settings, where you can set the range and the scale for both axes.
What does the 'graph' button do on the calculator?
-The 'graph' button on the calculator is used to display the graph of the entered equation(s) on the screen.
How can you remove or turn off one of the equations from being graphed?
-To remove or turn off one of the equations, you can use the 'Clear' button to erase it, or highlight the equal sign and press enter to turn off that specific equation.
What is the purpose of the trace feature on the calculator?
-The trace feature allows you to evaluate specific points on the graph by placing a cursor on the graph and finding the corresponding X and Y values.
How can you find the exact value of Y for a given X on the graph using the trace feature?
-To find the exact value of Y for a given X, you can use the numerical buttons to input the desired X value, press enter, and the calculator will display the corresponding Y value.
Outlines
📚 Introduction to Graphing with TI-83/84 Calculators
This paragraph introduces a tutorial on how to use TI-83 or 84 calculators for basic graphing. The focus is on entering equations, adjusting window size, and viewing graphs. The video will also cover trace features to evaluate graphs. The process begins with turning on the calculator and accessing the 'y equals' screen to enter equations, such as 'x cubed minus 2x'. Variables are entered using specific buttons, and equations are stored for viewing. Adjusting the window size is crucial for obtaining a clear graph, with default settings typically ranging from -10 to 10 for both x and y-axes. The tutorial emphasizes the importance of adjusting these settings to fit the graph's scale and details.
📐 Adjusting Window Settings and Graphing Equations
The second paragraph delves into adjusting window settings for better graph visualization and demonstrates how to graph equations. The window settings are modified to a smaller range, between -6 and 6 for both x and y-axes, to capture the details of the graph. The graph of 'y equals x cubed minus 2x' is shown as an example. Additionally, the tutorial explains how to enter a second equation, 'the square root of x minus 20', and the necessity of adjusting the window for this equation to accommodate its shifted position. The window settings are changed to view the graph effectively, with the x-axis range extended to 30. The paragraph concludes with instructions on how to clear or toggle the visibility of equations on the graph.
🔍 Utilizing Trace Features for Graph Evaluation
This paragraph highlights the trace feature on the calculator, which allows users to find specific points on the graph. By pressing the trace button, a cursor appears on the graph that can be moved using arrow buttons to identify points. The tutorial shows how to use the cursor to find approximate values, such as at x equals 1.9 and y equals 3.19. For more precision, users can input exact x values using the numerical buttons, and the calculator will display the corresponding y value and location on the graph. The trace feature is beneficial for evaluating specific x values and obtaining accurate coordinates on the graph.
Mindmap
Keywords
💡TI-83/84 Calculators
💡Graphing
💡Y-Equals Screen
💡Equation Entry
💡Window Size
💡Graph Button
💡Trace Features
💡X and Y Scale
💡Clear Button
💡Numerical Buttons
Highlights
Introduction to using TI-83 or 84 calculators for basic graphing.
How to enter equations on the 'y=' screen.
Entering the equation 'x^3 - 2x' using the calculator's input.
Explanation of variable input using the 'x', 'T', 'θ', and '^' buttons.
Storing the entered equation in the calculator.
Adjusting window size for better graph visualization.
Setting X and Y min/max values for graph window.
Explanation of X scale and Y scale settings.
Activating the graph feature to visualize the equation.
Graphing the equation 'y = x^3 - 2x'.
Adding a second equation '√(x - 20)' to the graph.
Adjusting the window for the second equation to be visible.
Graphing both equations on the same screen.
Removing or turning off equations from the graph.
Using the trace feature to evaluate specific points on the graph.
Navigating to specific x-values for precise evaluation.
Final thoughts on getting started with graphing calculator features.
Invitation to visit mysecretmathtutor.com for more videos.
Transcripts
Browse More Related Video
Basic Math - Graphing with a Casio fx-9750GII Calculator
TI-84 Plus Graphing Calculator Guide: Graphing functions

TI84 Graph a line and find table of values
TI84 Plus CE Plotting and Graphing Points

Statistics - Making a scatter plot using the Ti-89 calculator
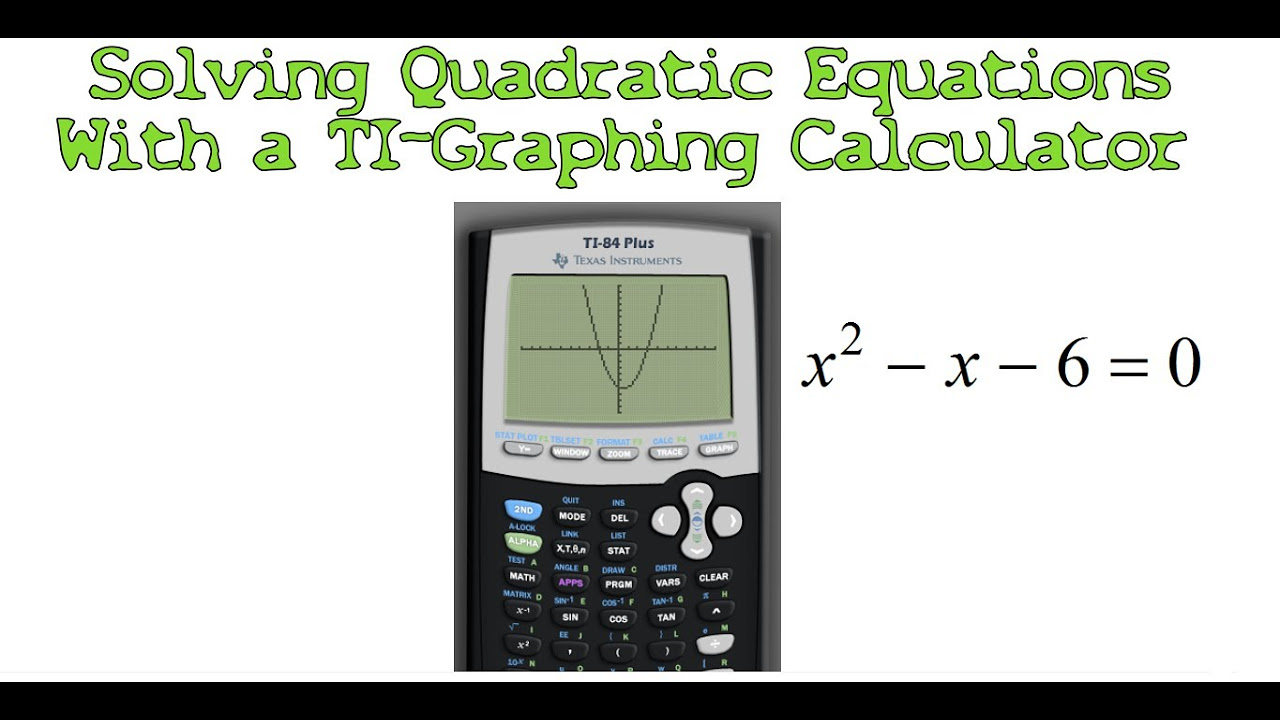
Solving Quadratic Equations with a TI-Graphing Calculator
5.0 / 5 (0 votes)
Thanks for rating: