Quadratic Equations using a TI 83 Plus Graphing Calculator
TLDRThis instructional video delves into graphing quadratic equations using the TI-83 Plus graphing calculator, emphasizing the creation of parabolas. It walks viewers through key aspects of parabolas, including finding the vertex, axis of symmetry, roots, and Y-intercept. Starting with the equation y = x^2 - 6x + 5, the tutorial explains how to input equations, utilize graphing tools, and interpret the graphical representation. Additionally, it covers troubleshooting steps for adjusting the viewing window and provides tips for accurately sketching parabolas on graph paper, ensuring viewers can effectively visualize and understand the characteristics of quadratic functions.
Takeaways
- 📈 The process involves graphing a quadratic equation using a TI-83 Plus calculator, resulting in a parabolic graph.
- 🔍 Key features of a parabola to identify include the vertex, axis of symmetry, roots, and Y-intercept.
- 📊 The quadratic equation example provided is y = x^2 - 6x + 5, which has a parabolic shape.
- 🛠️ The calculator's graphing process starts with entering the equation correctly using the 'y=' function.
- 🔎 Zoom 6 is used as a standard graphing option to visualize the parabola initially.
- 📍 Finding the vertex involves using the calculator's 'minimum' function and following the on-screen prompts.
- 🌟 The axis of symmetry is determined by the x-value of the vertex and is an imaginary line of reflection for the parabola.
- 🔑 Roots are calculated using the 'zero' function on the calculator, identifying points where the parabola intersects the x-axis.
- 📈 The Y-intercept is easily found by calculating the value of the equation when x=0, which is the constant term in the quadratic equation.
- 🖼️ Adjusting the graph window allows for a better view of the parabola, especially when parts of it are off-screen.
- 📝 A manual sketch of the parabola can be made by plotting the vertex, axis of symmetry, roots, and Y-intercept on graph paper.
Q & A
What is the basic shape of the graph of a quadratic equation?
-The graph of a quadratic equation forms a parabola, which has a U-shape.
Which graphing calculator is used in the tutorial for graphing a quadratic equation?
-The tutorial uses the TI-83 Plus graphing calculator.
What are some key aspects of a parabola that are important for graphing?
-Key aspects include the vertex, axis of symmetry, roots (or zeros), and the Y-intercept.
What is the initial step before graphing on the TI-83 Plus calculator?
-The initial step is to ensure that stat plots are turned off by choosing option four to avoid conflicts during graphing.
How do you enter a quadratic equation into the TI-83 Plus calculator?
-Go into 'Y=' and enter the equation using the format for quadratic equations, ensuring the quadratic, linear, and constant parts are correctly input.
What is the standard zoom option recommended for initially graphing a quadratic equation on the TI-83 Plus?
-Zoom 6 is recommended as the standard option for initially graphing the equation.
How can the vertex of a parabola be found using the TI-83 Plus?
-The vertex can be found by using the 'Second' button followed by 'Trace' to access the 'Calc' menu, then choosing the option for minimum or maximum depending on the parabola’s direction.
What is the axis of symmetry in relation to a parabola, and how is it determined?
-The axis of symmetry is an imaginary line that divides the parabola into two mirror-image halves. It can be found using the x-value of the vertex, denoted as x = [vertex x-value].
How are the roots or zeros of a parabola found using the calculator?
-Roots or zeros are found by using the 'Calc' menu to calculate the 'zero' function, ensuring the cursor is placed to the left and right of each root for accurate calculation.
Why might you need to adjust the viewing window when graphing a quadratic equation, and how is this done?
-Adjusting the viewing window is necessary when the parabola does not fit within the default view. This can be done using the 'Window' setting to customize the scale and range.
Outlines
📈 Introduction to Graphing Quadratic Equations
This paragraph introduces the concept of graphing quadratic equations using a TI-83 Plus graphing calculator. It explains that the graph of a quadratic equation is a parabola, an U-shaped curve. The key aspects of a parabola that are discussed include finding the vertex, axis of symmetry, roots, and Y-intercept. The paragraph begins with a simple equation, y = x^2 - 6x + 5, and breaks down the parts of a quadratic equation: the quadratic part (x^2), the linear part (-6x), and the constant part (5). It emphasizes the importance of understanding these components to accurately graph the equation.
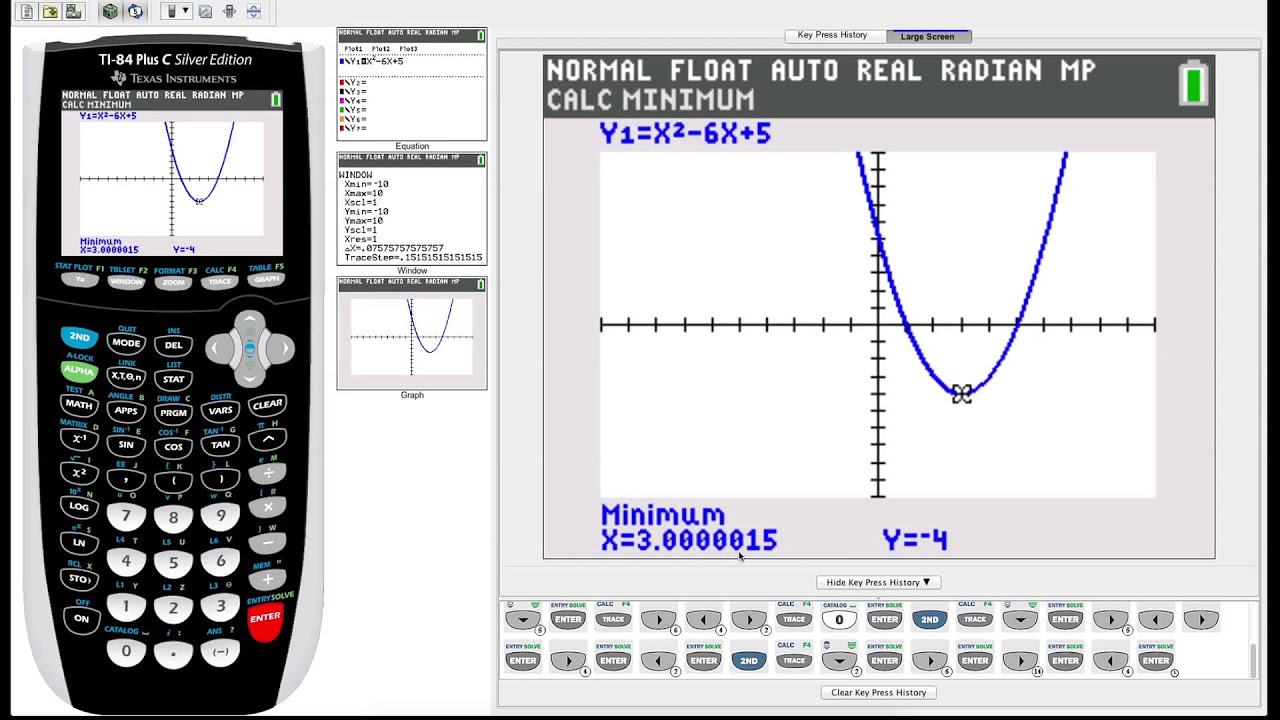
📊 Graphing the Equation and Finding the Vertex
The paragraph demonstrates how to enter the quadratic equation into the graphing calculator and use the zoom 6 option to visualize the parabola. It explains that the vertex of the parabola can be found using the calculator's minimum feature. The process involves setting bounds and allowing the calculator to guess the minimum point, which in this case is (-3, -4). The paragraph then describes how to verify the vertex by calculating the Y value when x is -3, confirming that the vertex is indeed at (-3, -4). It also briefly touches on sketching the graph on paper based on the calculated points.
🔍 Locating the Axis of Symmetry and Roots
This paragraph focuses on finding the axis of symmetry and the roots of the parabola. The axis of symmetry is determined as the line where x equals the x-value of the vertex, which is x = 3 in this case. The roots, or the points where the parabola intersects the x-axis, are found using the calculator's zero feature. The process involves setting bounds and using the calculator to guess the roots, which are found to be x = 1 and x = 5. The paragraph emphasizes the importance of careful selection of bounds to avoid errors and ensure accurate results.
📉 Adjusting the Window for a Better View
The paragraph discusses the use of the zoom fit option to adjust the viewing window when dealing with parabolas that do not fit well within the default window settings. It explains that the zoom fit option can rescale the graph to display the entire parabola on the screen. The paragraph then describes how to fine-tune the window by adjusting the minimum and maximum values for the x and y axes to get a clearer view of the parabola's key points, such as the roots and vertex.
📐 Calculating the Vertex, Axis of Symmetry, and Y-Intercept for a More Complex Parabola
The paragraph presents a more complex parabola equation, 4x^2 - 7x - 19, and guides through the process of finding its vertex, axis of symmetry, roots, and Y-intercept. It explains the steps of using the calculator's minimum feature to find the vertex coordinates, which are approximately (8.88, -22.06). The axis of symmetry is calculated as x = 8.88, and the roots are found to be x = 1.47 and x = 3.22 using the zero feature. The Y-intercept is determined as -19 by calculating the value when x is zero. The paragraph concludes with a brief overview of sketching the parabola on paper based on the calculated points.
Mindmap
Keywords
💡Quadratic Equation
💡Parabola
💡Vertex
💡Axis of Symmetry
💡Roots
💡Y-intercept
💡TI-83 Plus Graphing Calculator
💡Zoom 6
💡Left Bound and Right Bound
💡Graphing Process
Highlights
Introduction to graphing quadratic equations using the TI-83 Plus graphing calculator.
Key aspects of a parabola: vertex, axis of symmetry, roots, and Y intercept.
Explanation of quadratic equation components: quadratic part, linear part, and constant part.
Initial setup on the TI-83 Plus: turning off stat plots.
Entering and graphing the quadratic equation using Zoom 6 for a standard view.
Finding the vertex using the 'minimum' function on the calculator.
Using the calculator to verify the vertex location by calculating a value.
Determining the axis of symmetry directly from the vertex's x-value.
Calculating the roots (zeros) of the parabola using the 'zero' function.
Finding the Y intercept as the easiest point to calculate.
Adjusting the graph window for parabolas that don't fit the standard view.
Using the 'zoom fit' option for better visualization of the entire parabola.
Adjusting window settings manually for optimal graph view.
Sketching the parabola on paper, incorporating the vertex, axis of symmetry, roots, and Y intercept.
Discussion on how the calculator might round values and the importance of verifying these calculations.
Transcripts
Browse More Related Video
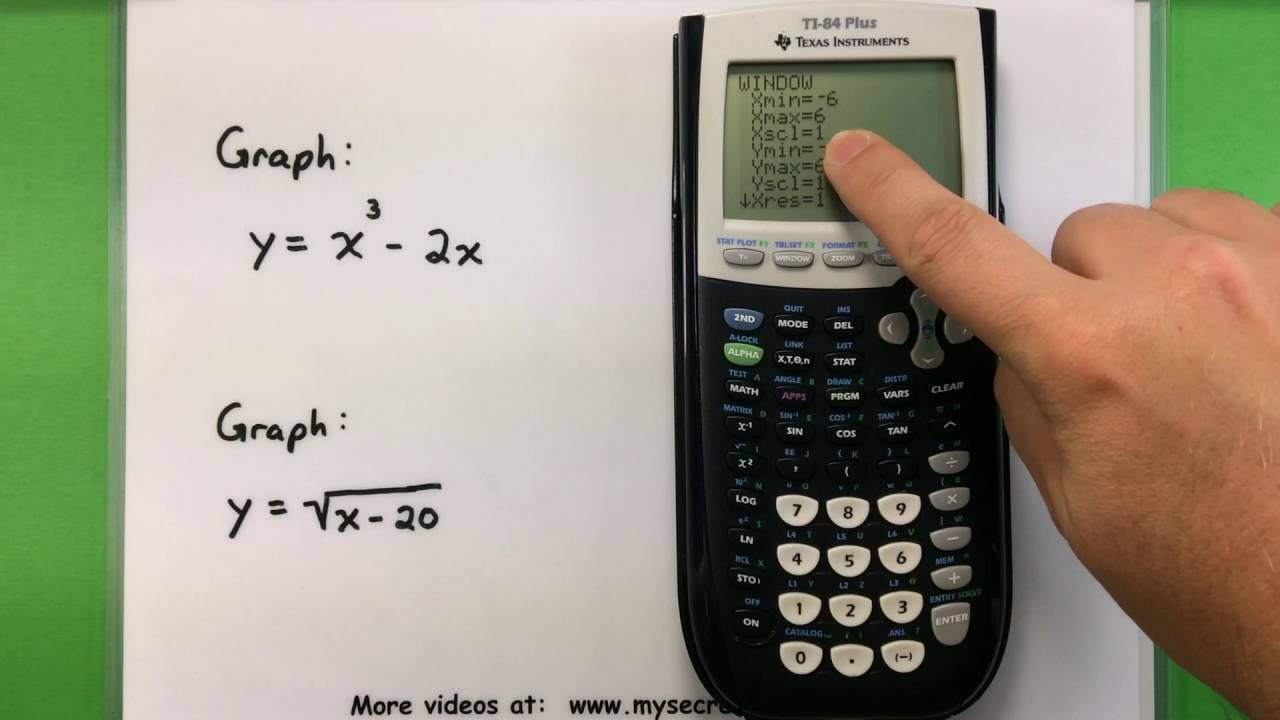
Basic Math - Graphing with a Ti-83 or Ti-84 Calculator
Using Your TI-84 Plus CE Part 2: Basic Graphing
TI-84 Plus Graphing Calculator Guide: Graphing functions
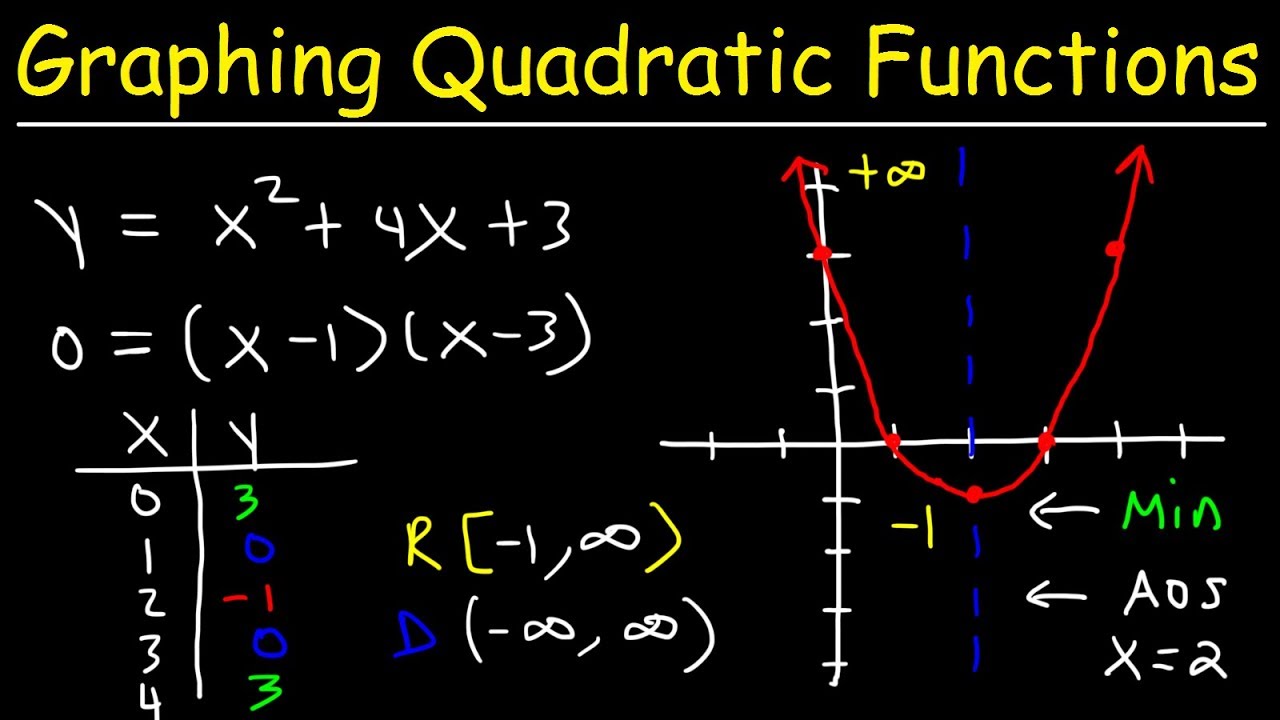
Graphing Quadratic Functions In Standard Form Using X & Y Intercepts | Algebra
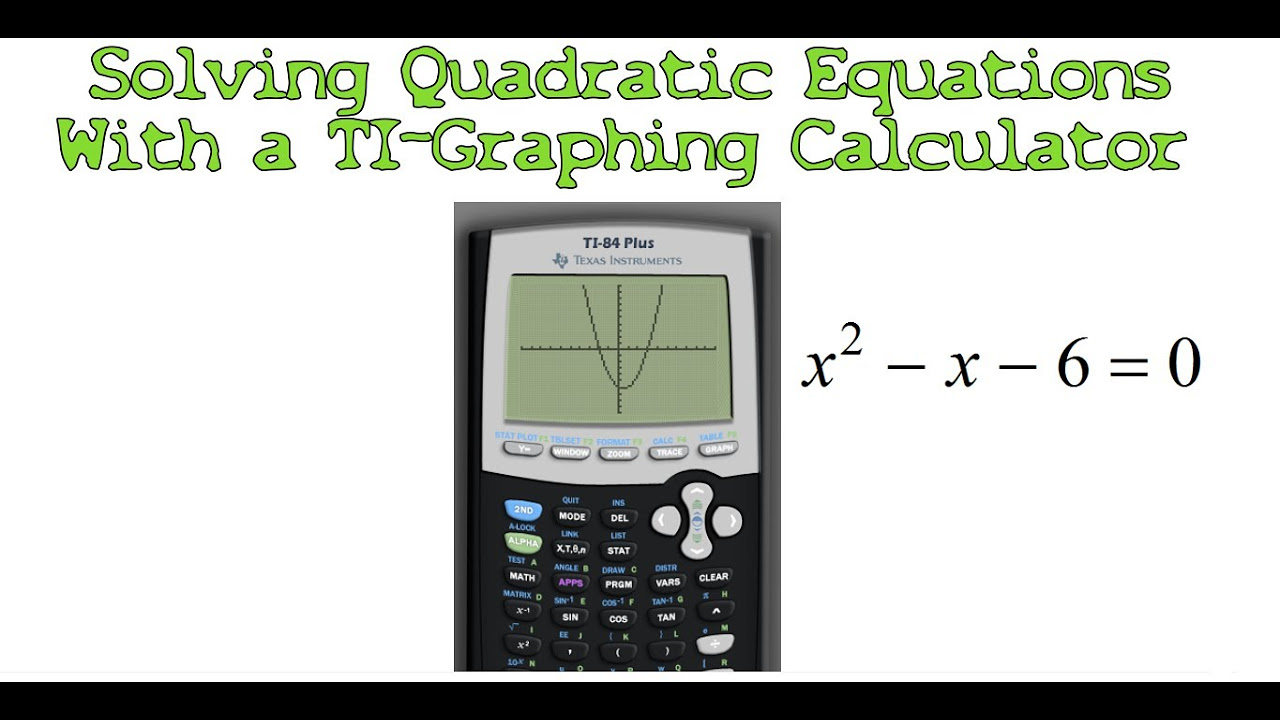
Solving Quadratic Equations with a TI-Graphing Calculator

TI84 Graph a line and find table of values
5.0 / 5 (0 votes)
Thanks for rating: