TI-84 Plus Graphing Calculator Guide: Graphing functions
TLDRThis video tutorial introduces users to the TI-84 graphing calculator, focusing on graphing functions. It guides viewers through turning off plots, entering equations, adjusting window settings, and graphing quadratic functions. The video also demonstrates how to find x and y intercepts, minimum and maximum values, and the intersection of two graphs. Additionally, it briefly touches on graphing in polar and parametric coordinates, offering a comprehensive guide to utilizing the calculator's capabilities for mathematical visualization.
Takeaways
- 📈 Start by turning off all plots to avoid interference when graphing new functions on the TI-84 calculator.
- 📱 Access the graphing function by pressing 'y=' and selecting the desired function slot (e.g., '1' for the first function).
- 🔢 Enter the quadratic function using the 'x' key and the variable key, for example, 'x^2 - 6x + 5'.
- 🖼️ Check and adjust window settings using the 'window' key to control the range and scale of the graph.
- 🔍 Use the 'graph' button to display the function on the main screen.
- 🔎 Zoom in and out using the 'zoom' button and its preset options, such as 'Zstandard' for a standard view.
- 📍 Find the y-intercept by setting x=0 and using the 'trace' button to locate the intersection on the y-axis.
- 📉 Calculate x and y intercepts, as well as maximum and minimum values using the 'calc' menu and its options.
- 🤝 Identify the intersection points of two graphs by using the 'intersect' feature under the 'calc' menu.
- 🌐 Switch between different graphing modes such as parametric and polar coordinates using the 'mode' key.
- 📊 Understand that the calculator's capabilities extend to graphing in various forms, including finding intersections, intercepts, and extreme values.
Q & A
What is the first step to take before entering an equation on the TI-84 graphing calculator?
-The first step is to ensure that all plots are off. This can be done by pressing the '2nd' button, navigating to the 'y=' option, selecting 'stat plot', and then choosing the number '4'. This action turns off all the plots to avoid interference with the new graphing.
How many functions can you graph simultaneously on the TI-84 calculator?
-You can graph up to 9 functions at the same time on the TI-84 calculator, labeled as y1 through y9.
What is the process for entering a quadratic function on the TI-84 calculator?
-To enter a quadratic function, you go to 'y=', press the 'x' key, and then enter the function in the form of x^2 - 6x + 5 or any other quadratic equation. You press 'enter' to confirm the input.
How do you adjust the window settings on the TI-84 calculator?
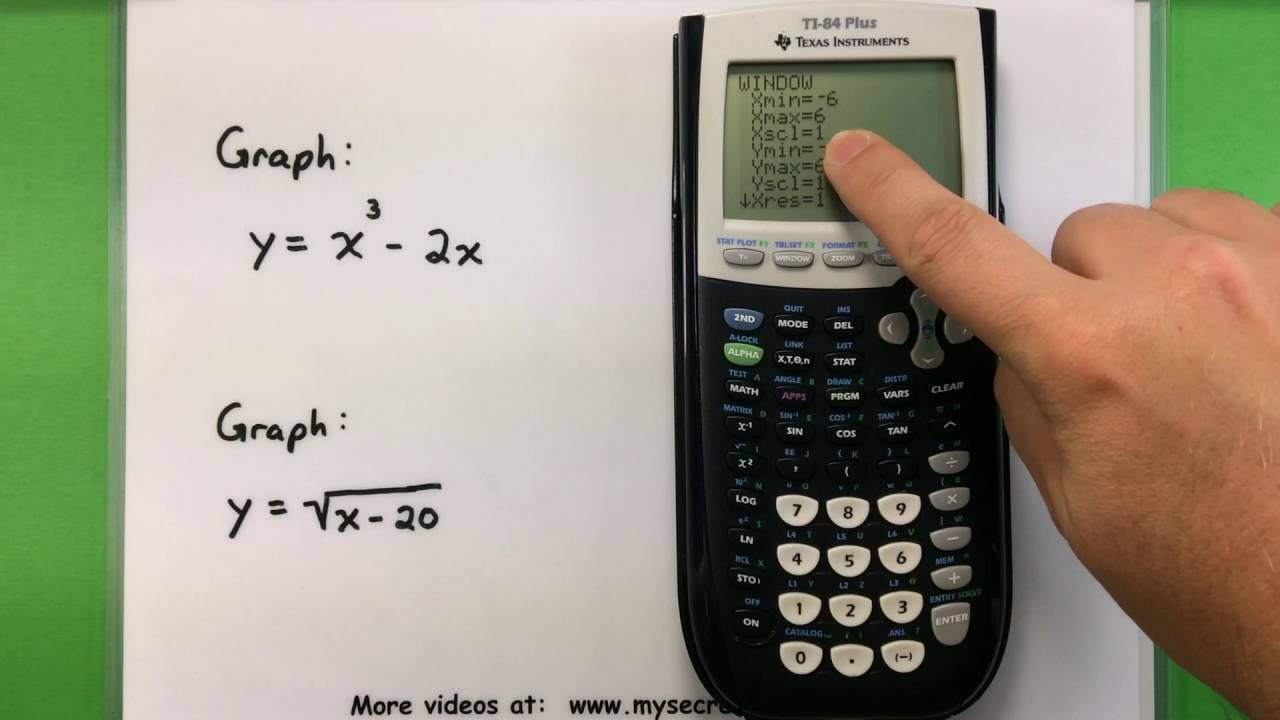
-You adjust the window settings by pressing the 'window' key next to 'y='. This allows you to set the Xmin, Xmax, Xscale, Ymin, and Ymax to customize the range and scale of the graph.
What is the purpose of the zoom button on the TI-84 calculator?
-The zoom button provides various preset sizes for the window, allowing you to change the viewing area of the graph. The 'Zstandard' option, for example, resets the window to its original settings of -10 by 10 on both the x and y axes.
How do you find the y-intercept of a graph on the TI-84 calculator?
-To find the y-intercept, you use the 'trace' button. You press 'trace', navigate to 'zero', and then input 'x=0' to find the point where the graph crosses the y-axis.
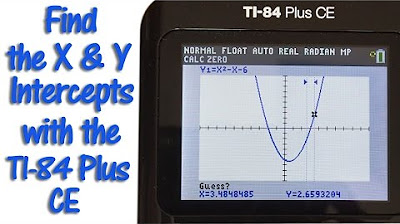
What is the process for finding the x-intercept on the TI-84 calculator?
-To find the x-intercept, you press '2nd' then 'trace', go to 'calc', and select 'zero'. You then move the cursor near the desired x-intercept, set a 'left bound', a 'right bound', and provide a 'guess' for the calculator to find the exact x-intercept where y=0.
How do you find the minimum value of a graph on the TI-84 calculator?
-You find the minimum value by pressing '2nd' then 'trace', going to 'calc', and selecting 'min'. You then set a 'left bound' and 'right bound' to define the range in which you want to find the minimum value, and the calculator will calculate the minimum point within that range.
What feature can be used to find the intersection point of two graphs on the TI-84 calculator?
-The 'intersect' feature can be used to find the intersection point of two graphs. You access this by pressing '2nd' then 'trace', going to 'calc', and selecting 'intersect'. You choose the two curves you want to find the intersection of, and the calculator will calculate the point of intersection.
How can you switch to graphing in polar or parametric coordinates on the TI-84 calculator?
-You switch to polar or parametric coordinates by pressing the 'mode' key, scrolling down to 'function', 'parametric', or 'polar', and selecting the desired mode. This changes the input fields and window settings to accommodate the specific type of graphing.
What is the main benefit of using the TI-84 graphing calculator for math functions?
-The main benefit of using the TI-84 graphing calculator is that it allows users to visualize and analyze mathematical functions, find intersections, minimum and maximum values, and intercepts, which aids in understanding the properties and behavior of the functions.
Outlines
📈 Introduction to Graphing Functions on TI-84
This paragraph introduces the process of graphing functions using a TI-84 calculator. It starts by explaining how to turn off all plots to avoid interference and then proceeds to demonstrate how to enter a quadratic function into the calculator. The speaker also emphasizes the importance of checking window settings before graphing and provides a step-by-step guide on how to set the Xmin, Xmax, Ymin, and Ymax values for the graph. Additionally, the paragraph covers how to use the zoom and trace features to better visualize and analyze the graph, including finding the x and y intercepts of the function.
🔍 Finding Intercepts and Extreme Values
The second paragraph focuses on using the calculator's features to find the x and y intercepts of a graph, as well as its maximum and minimum values. It explains the process of using the calc menu to determine these points, including setting bounds and making educated guesses to narrow down the search. The paragraph also discusses how to use the intersect feature to find the points where two graphs intersect, providing a clear demonstration of how to switch between different curves and calculate the exact intersection values.
🌐 Exploring Polar and Parametric Graphing
This paragraph delves into the advanced graphing capabilities of the TI-84 calculator, such as graphing in polar and parametric coordinates. It explains how to switch between different graphing modes using the mode key and provides a brief overview of how to input functions for parametric graphs. The speaker also touches on how the window settings change to accommodate these different types of graphs, highlighting the versatility of the calculator in handling various mathematical concepts. The paragraph concludes by summarizing the functions covered in the video and encourages viewers to explore more resources for learning about graphing and mathematics.
Mindmap
Keywords
💡graphing calculator
💡quadratic function
💡window settings
💡zoom
💡trace
💡intercepts
💡minimum value
💡intersection
💡polar coordinates
💡parametric coordinates
💡graphing functions
Highlights
Introduction to graphing functions on a TI-84 calculator.
Turning off all plots for a clean graphing start.
Using Y= to enter and graph functions with up to 9 different functions (Y1 through Y9).
Graphing a quadratic function (x^2 - 6x + 5) as an example.
Checking and adjusting window settings for optimal graph view.
Using the zoom feature to better view the graph and its properties.
Finding the y-intercept of a function by setting x to 0.
Using the calc menu to find the x-intercept by setting y to 0 and using bounds.
Calculating the minimum value of the function using the calc menu.
Utilizing the intersect feature to find the point of intersection between two functions.
Switching between different graphing modes such as parametric and polar coordinates.
Changing the function and window settings to graph in parametric mode.
Adjusting the graph to display in polar coordinates by changing the mode settings.
Returning to the standard function graphing mode by selecting 'function'.
Summary of the functions learned: graphing, finding intersections, minimum values, and intercepts.
Encouragement to subscribe to the YouTube channel and visit the website for more math-related content.
Transcripts
Browse More Related Video
Basic Math - Graphing with a Ti-83 or Ti-84 Calculator
TI 84 Plus CE Calculator Find the X and Y Intercepts
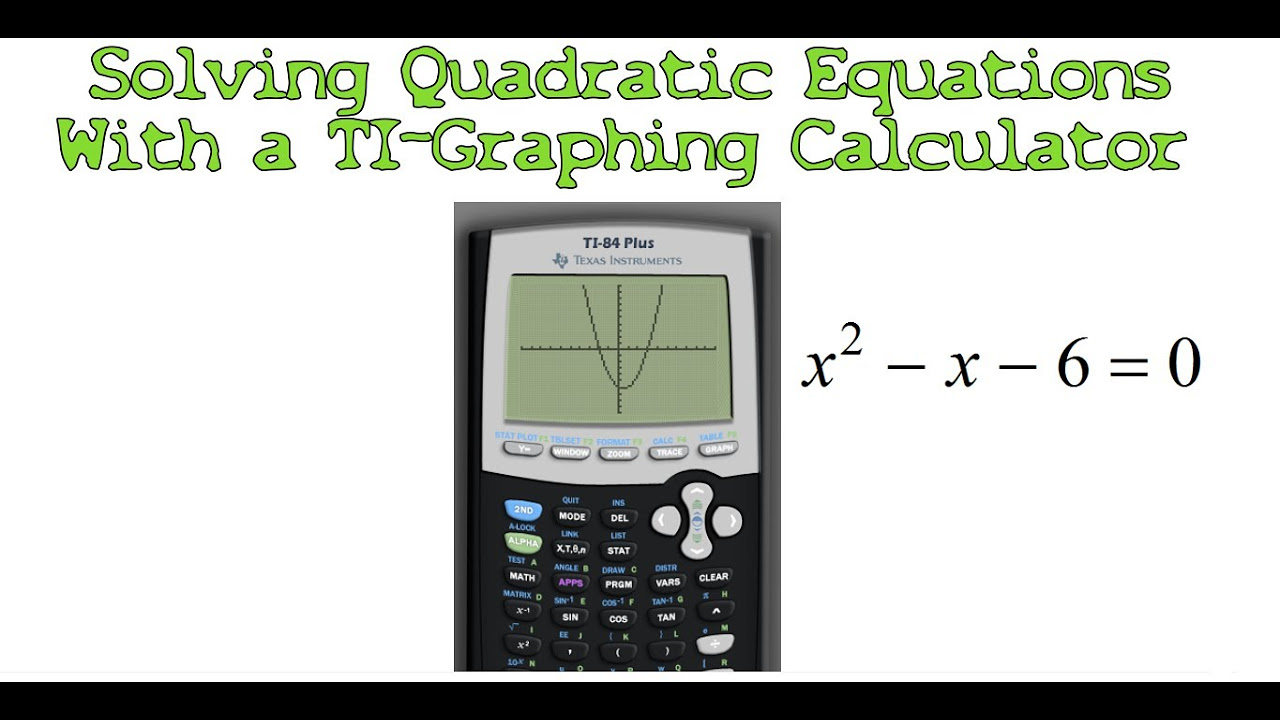
Solving Quadratic Equations with a TI-Graphing Calculator
Calculator Tutorial - Intro to the TI 84 Plus
TI84 Plus CE Plotting and Graphing Points

Graphing Functions on a TI-84 Calculator - Lesson 2
5.0 / 5 (0 votes)
Thanks for rating: