6.3.2 Sampling Distributions and Estimators - Sampling Distribution of Sample Proportions
TLDRThis video script delves into the sampling distribution of sample proportions, illustrating its relationship with the population proportion. It uses a concrete example involving a small population to demonstrate how the mean of sample proportions converges to the population proportion, emphasizing the normal distribution's role in this context. The script further explores the concept through rolling a die, showing that the mean of sample proportions approximates the true population proportion, highlighting the unbiased nature of sample proportions as estimators.
Takeaways
- 📚 The script discusses learning outcome number two of lesson 6.3, focusing on the sampling distribution of sample proportions and its relation to the population proportion.
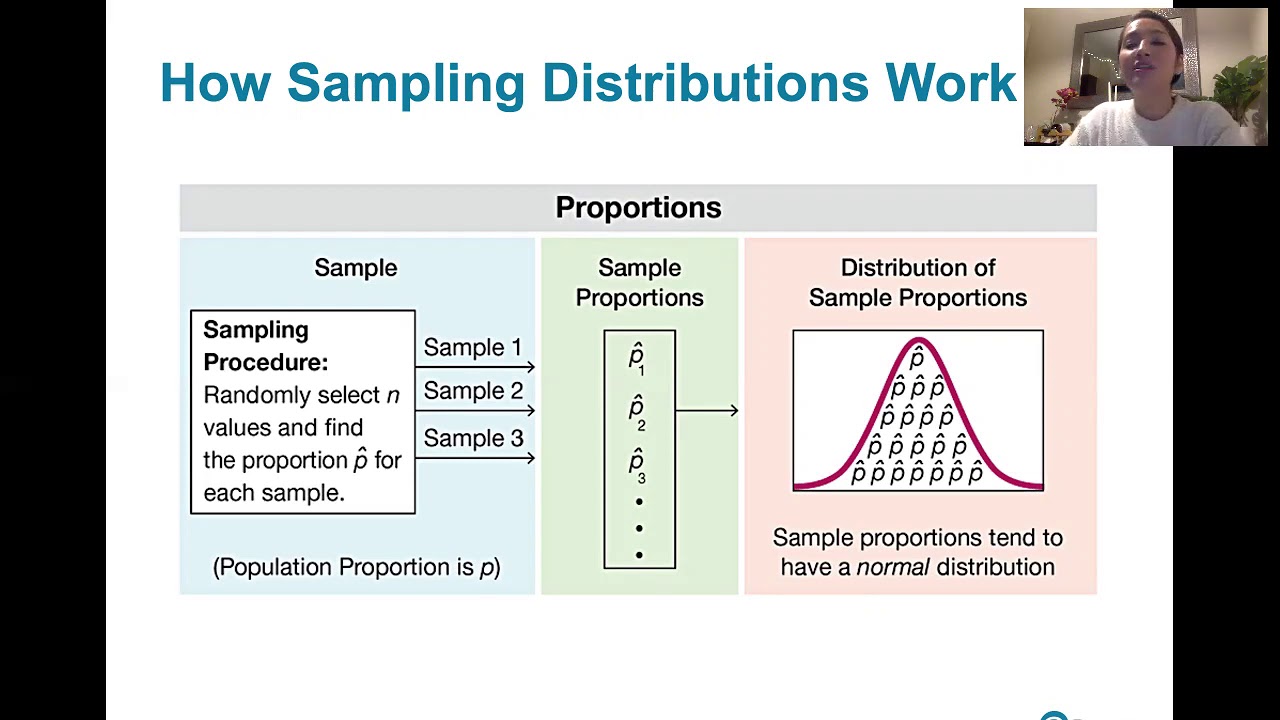
- 📝 The sampling distribution of the sample proportion (p-hat) is the distribution of all possible values of p-hat obtained from all possible samples of the same size n from the same population.
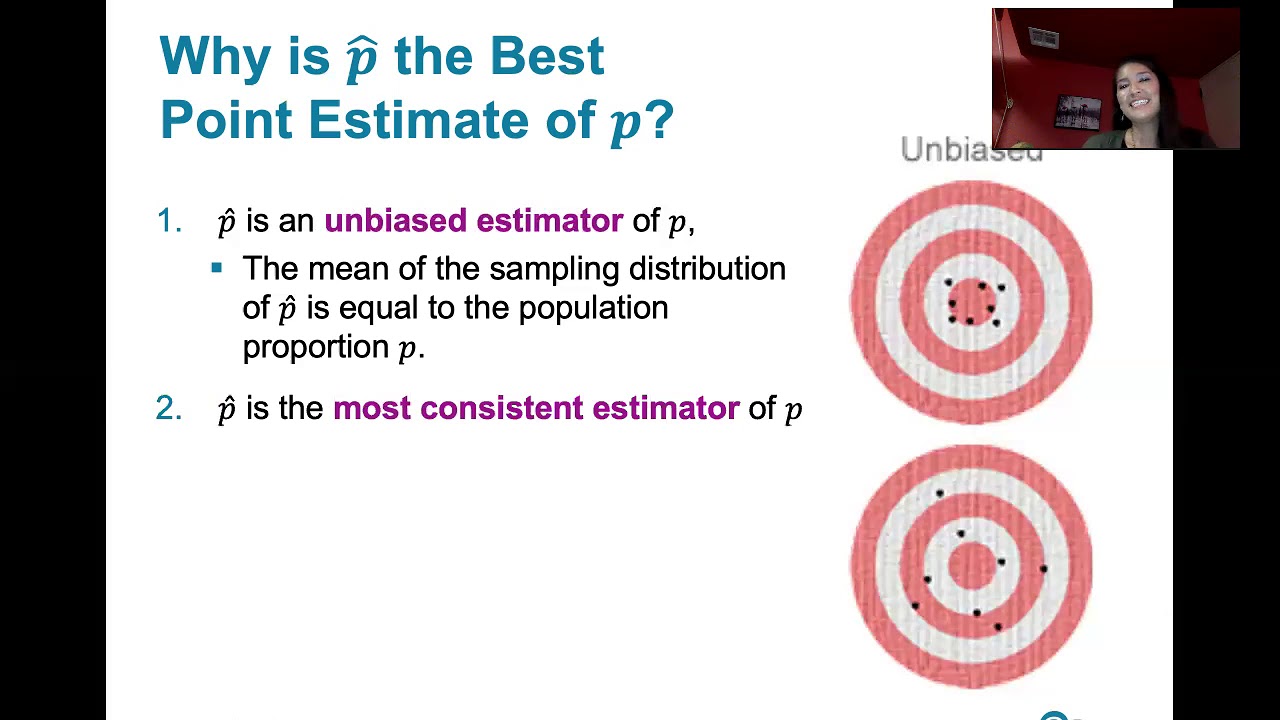
- 🎯 The sample proportion p-hat is an estimator of the population proportion (p), and the mean of the sampling distribution of p-hat is expected to be equal to the population proportion p.
- 📈 The distribution of sample proportions tends to approximate a normal distribution, which is symmetric about the mean and targets the population proportion.
- 🌰 An example is provided with a population of three numbers (4, 17, 11) to illustrate the concept of the sampling distribution of sample proportions.
- 🔢 The population proportion of even numbers in the example is calculated to be one-third, as there is one even number out of three total numbers.
- 🃏 The example continues by listing all possible samples of size n=2 with replacement and calculating the sample proportion for each sample.
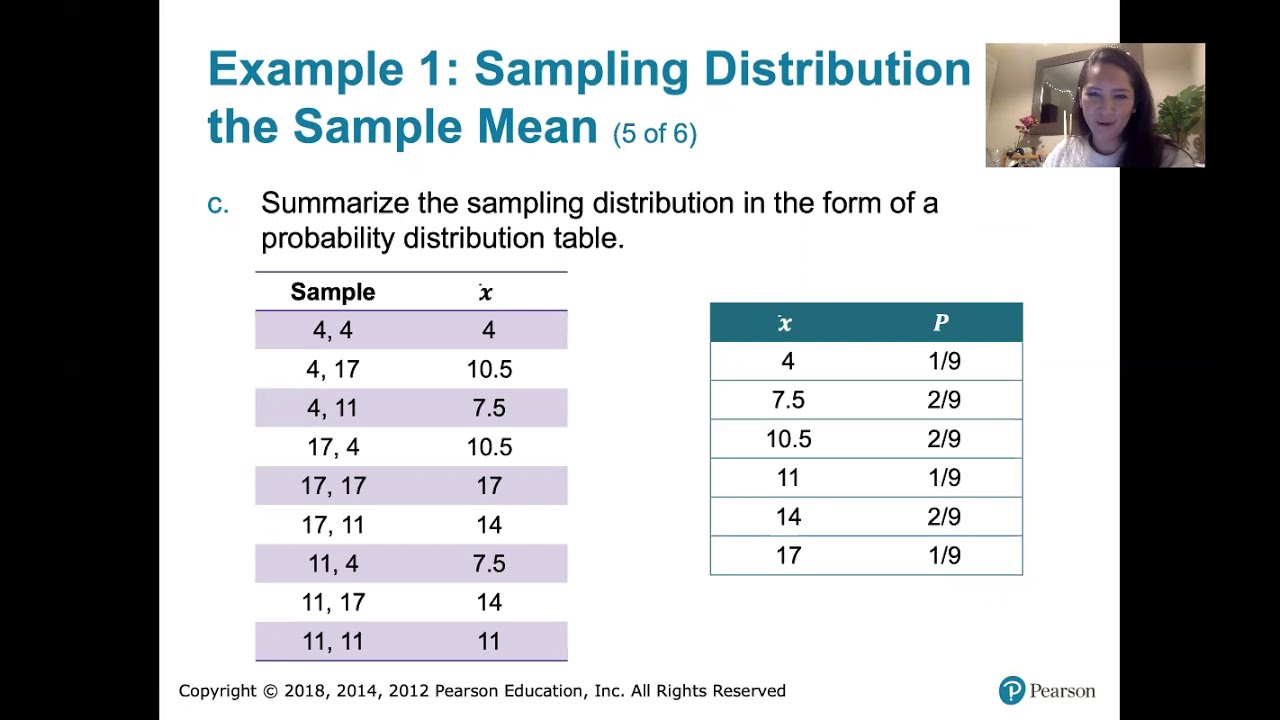
- 📊 The sampling distribution is summarized in a probability distribution table, showing the possible sample proportions and their associated probabilities.
- 🧮 The script demonstrates that the mean of the sample proportions is equal to the population proportion by calculating the expected value of p-hat.
- 🎲 A second example involves rolling a die five times and calculating the proportion of odd numbers, showing the behavior of sample proportions over 10,000 trials.
- 📊 The distribution of sample proportions from the die-rolling example is approximately normal and has a mean close to the true population proportion of odd numbers, which is 0.5.
Q & A
What is the sampling distribution of a sample proportion?
-The sampling distribution of a sample proportion, denoted as p-hat, is the distribution of all possible values of that sample proportion when all possible samples of the same size n are taken from the same population.
What is the relationship between the sample proportion and the population proportion?
-The sample proportion (p-hat) is an estimator of the population proportion (p). The mean of the sampling distribution of sample proportions is expected to be equal to the population proportion, making p-hat a good estimator for p.
Why does the distribution of sample proportions tend to approximate a normal distribution?
-According to the Central Limit Theorem, as the sample size increases, the distribution of the sample proportions tends to approximate a normal distribution regardless of the shape of the population distribution. This is due to the averaging effect that occurs with larger samples.
What is the significance of the mean of the sampling distribution of sample proportions?
-The mean of the sampling distribution of sample proportions is significant because it is expected to be equal to the population proportion. This property makes sample proportions unbiased estimators of the population proportion.
How many possible samples are there when selecting with replacement from a population of size 3 for a sample size of n=2?
-When selecting with replacement from a population of size 3 for a sample size of n=2, there are 9 possible samples. This is calculated as 3 choices for the first selection multiplied by 3 choices for the second selection.
What is the population proportion of even numbers in the example with the population consisting of 4, 17, and 11?
-In the example with the population consisting of 4, 17, and 11, the population proportion of even numbers is 1/3, as there is only one even number (4) out of the three numbers.
How are the possible sample proportions calculated for a sample size of n=2 from the given population?
-The possible sample proportions are calculated by determining the number of even numbers in each possible sample of size n=2 and then dividing by the sample size. The possible proportions are 0 (no even numbers), 1/2 (one even number), and 1 (all numbers are even).
What is the purpose of summarizing the sampling distribution in the form of a probability distribution table?
-Summarizing the sampling distribution in the form of a probability distribution table helps to visualize the probabilities associated with each possible sample proportion, making it easier to understand the distribution's characteristics and to calculate the mean of the sample proportions.
How does the example of rolling a die five times and calculating the proportion of odd numbers illustrate the behavior of sample proportions?
-The die-rolling example illustrates that when a process is repeated a large number of times (10,000 times in the example), the distribution of sample proportions becomes approximately normal and its mean is close to the true population proportion, which in the case of a fair die is 0.5 for odd numbers.
What does it mean for a sample proportion to be an unbiased estimator of the population proportion?
-A sample proportion being an unbiased estimator of the population proportion means that the mean of the sampling distribution of the sample proportion is equal to the population proportion. This property ensures that the estimator does not systematically overestimate or underestimate the population parameter.
Outlines
📚 Introduction to Sampling Distribution of Sample Proportions
This paragraph introduces the concept of the sampling distribution of sample proportions, denoted as p-hat, which is the distribution of all possible values of the sample proportion when samples of the same size n are taken from the same population. The p-hat serves as an estimator for the population proportion, denoted by p. The paragraph explains that the distribution of these sample proportions tends to approximate a normal distribution, symmetric about the mean, with the mean of these sample proportions expected to be equal to the population proportion p. An example is introduced to illustrate these concepts, where a population of three numbers is used to calculate the population proportion of even numbers and to list all possible samples of size n=2 with replacement, aiming to show how the mean of the sampling distribution compares to the population proportion.
🔍 Calculating Sample Proportions and Their Distribution
The paragraph delves into the process of calculating the sample proportions from all possible samples of size n=2 from a given population, and then summarizing the sampling distribution in the form of a probability distribution table. It explains how to find the sample proportion for each sample, which in this case can be zero, one-half, or one, depending on the number of even numbers in the sample. The paragraph also discusses the process of computing the mean of the sample proportions, which is shown to be equal to the population proportion, demonstrating the unbiased nature of the sample proportion as an estimator.
🎲 Exploring the Behavior of Sample Proportions with a Dice-Rolling Experiment
This section of the script explores the behavior of sample proportions through a practical example of rolling a die five times and calculating the proportion of odd numbers in each roll. The paragraph discusses the process of repeating this experiment 10,000 times to gather data on the distribution of sample proportions. It describes how the distribution of these proportions appears to be normally distributed, with a mean close to the expected population proportion of odd numbers on a die, which is 0.5. The paragraph also touches on the concept of relative frequency as an approximation of probability and how it can be used to estimate the probabilities of different sample proportions.
📊 Analyzing the Distribution and Mean of Sample Proportions from Dice Rolls
The paragraph continues the discussion on the dice-rolling experiment, focusing on the distribution and mean of the sample proportions obtained from rolling a die five times repeatedly. It provides a detailed analysis of the frequencies and relative frequencies of the different possible sample proportions, such as zero out of five, one out of five, and so on, up to five out of five odd numbers. The paragraph demonstrates how to convert these frequencies into relative frequencies to approximate the probabilities of each outcome and how to calculate the mean of these sample proportions, which is found to be very close to 0.5, aligning with the expected population proportion of odd numbers on a die.
📉 Estimating Probabilities and Mean from Sample Proportions
This paragraph discusses the process of estimating probabilities and calculating the mean from the sample proportions obtained in the dice-rolling experiment. It explains how to convert the observed frequencies into relative frequencies by dividing by the total number of trials, which provides an approximation of the probability of each sample proportion outcome. The paragraph also describes the calculation of the mean of the sample proportions by multiplying each sample proportion by its corresponding estimated probability and summing these products, resulting in a mean that is close to the theoretical value of 0.5 for the population proportion of odd numbers on a die.
🔚 Conclusion on the Sampling Distribution of Sample Proportions
The final paragraph wraps up the discussion by emphasizing the key takeaways about the sampling distribution of sample proportions. It reiterates that the distribution is approximately normal and that the mean of this distribution equals the population proportion, making sample proportions a good and unbiased estimator of the population proportion. The paragraph also previews the next topic, which will be the sampling distribution of sample means, indicating a continuation of the theme in subsequent educational content.
Mindmap
Keywords
💡Sampling Distribution
💡Sample Proportion (p-hat)
💡Population Proportion (p)
💡Estimator
💡Normal Distribution
💡Mean
💡Biased vs. Unbiased Estimator
💡With Replacement
💡Probability Distribution Table
💡Discrete Probability Distribution
Highlights
The sampling distribution of the sample proportion (p-hat) is the distribution of all possible values of p-hat from samples of the same size n taken from the same population.
The sample proportion p-hat is an estimator of the population proportion p.
The distribution of sample proportions tends to approximate a normal distribution and is symmetric about the mean.
The mean of the sample proportions is expected to be equal to the population proportion, making sample proportions a good estimator.
An example is given using a population of three numbers to illustrate the concept of the sampling distribution of sample proportions.
The population proportion of even numbers is calculated as one-third in the example provided.
All possible samples of size n=2 are listed, and the sample proportion for each is computed, demonstrating the sampling process.
A probability distribution table is used to summarize the sampling distribution of sample proportions.
The mean of the sample proportions is shown to be equal to the population mean, validating the estimator's accuracy.
A die-rolling experiment is introduced to further explore the behavior of sample proportions over a large number of trials.
The experiment reveals that the distribution of sample proportions from rolling a die five times approaches a normal distribution.
The mean of the sample proportions in the die-rolling experiment is calculated to be approximately 0.5, aligning with the theoretical population proportion.
The concept that the sample proportions are unbiased estimators of the population proportion is discussed.
The importance of the sample size in determining the shape and characteristics of the sampling distribution is highlighted.
The video concludes by emphasizing that the sampling distribution of sample proportions is approximately normal and its mean equals the population proportion.
The theoretical underpinnings of why the sample proportions are good estimators are briefly touched upon, promising more discussion in the next video.
The practical applications of understanding the sampling distribution of proportions in real-world scenarios are implied throughout the video.
The video provides a clear demonstration of how the theoretical concepts apply to a simple, relatable example of rolling dice.
The process of converting frequencies from an experiment to relative frequencies and then to probabilities is demonstrated.
The calculation of the mean of sample proportions from an experiment is shown, emphasizing the close relationship to the population proportion.
Transcripts
Browse More Related Video

6.3.4 Sampling Distribution and Estimators - Sampling Distribution of Sample Variance

Elementary Stats Lesson #14

Confidence Intervals for Population Proportions
6.3.1 Sampling Distributions and Estimators - Sampling Distributions Described and Defined
6.3.3 Sampling Distributions and Estimators - Sampling Distribution of the Sample Means
7.1.1 Estimating a Population Proportion - The Best Point Estimate, Our Sample Proportion p-Hat
5.0 / 5 (0 votes)
Thanks for rating: