Descriptive Statistics: FULL Tutorial - Mean, Median, Mode, Variance & SD (With Examples)
TLDRThis video script offers an accessible introduction to descriptive statistics, essential tools for summarizing and understanding quantitative data sets. It distinguishes descriptive statistics from inferential statistics, emphasizing the former's role in identifying data issues and informing inferential analysis. The 'big seven' descriptives are explored, including measures of central tendency (mean, median, mode) and dispersion (range, variance, standard deviation), with practical examples illustrating their application. The script also highlights the importance of data shape and skewness in statistical analysis, providing a foundation for further study in quantitative data analysis.
Takeaways
- 📊 Descriptive statistics are essential for summarizing and describing the basic features of a data set, providing a snapshot of its characteristics.
- 🔢 Basic descriptive statistics include counts, percentages, and proportions, which offer insight into the composition of data.
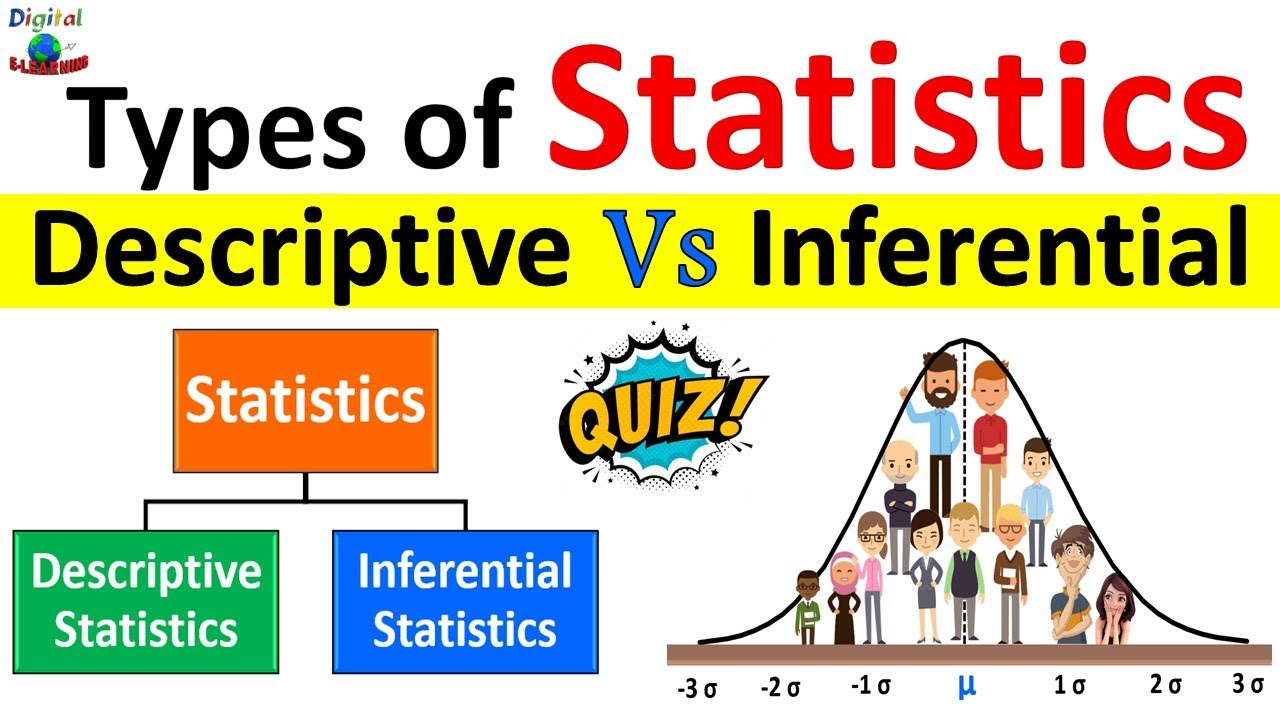
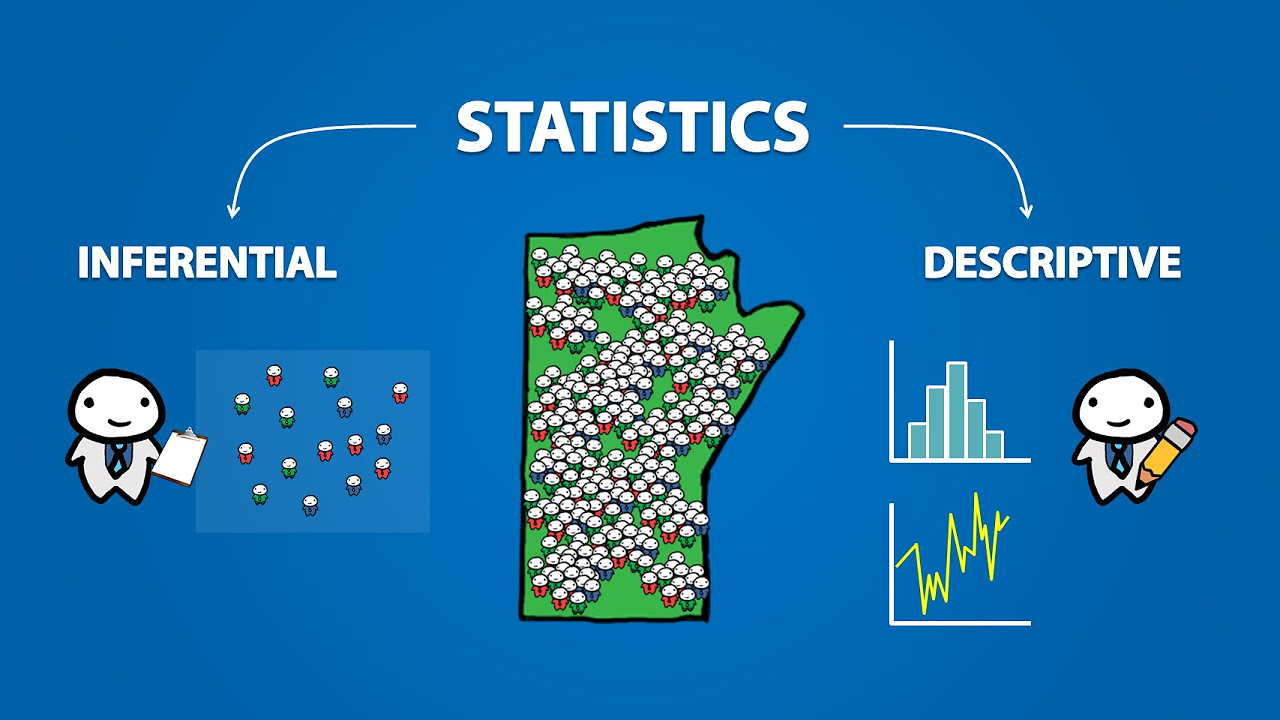
- 📚 Inferential statistics differ from descriptive statistics by using sample data to make predictions about a larger population.
- 👀 Descriptive statistics help identify potential issues within a data set, such as outliers and missing responses, which is crucial for data integrity.
- 📉 Descriptive statistics inform the decision-making process for inferential statistics by revealing the shape of the data, which is necessary for choosing the right inferential tests.
- 📈 Measures of central tendency, including mean, median, and mode, describe the center or typical data point within a range of numbers.
- 📊 Skewness is a statistic that measures the lean of data distribution to the left or right, impacting the interpretation of other statistics.
- 📊 Measures of dispersion, such as range, variance, and standard deviation, indicate how spread out the data is around the mean.
- 📉 A high range indicates the possibility of data being widely dispersed, but it doesn't confirm it without considering other measures of dispersion.
- 📚 Understanding the dispersion of data is critical for interpreting measures of central tendency, especially the mean, within context.
- 👍 The video provides practical examples and explanations to help viewers grasp the concepts of descriptive statistics and their application in data analysis.
Q & A
What are descriptive statistics?
-Descriptive statistics are a way to summarize and describe basic features of a quantitative data set, such as survey responses or sales data. They provide a snapshot of the data's characteristics, helping to understand the general shape and composition of the data.
Why are descriptive statistics important in quantitative analysis?
-Descriptive statistics are important because they allow for quick identification of potential issues within a data set, such as outliers or missing responses. They also inform the decision-making process when planning to use inferential statistics, as each test has specific requirements regarding the shape of the data.
How do descriptive statistics differ from inferential statistics?
-Descriptive statistics describe and summarize the data itself, while inferential statistics use data from a sample to make inferences or predictions about a larger population. In other words, descriptive statistics help understand the sample, whereas inferential statistics help make broader statements about the population based on that sample.
What are the 'big seven' descriptive statistics?
-The 'big seven' descriptive statistics refer to measures of central tendency (mean, median, mode) and measures of dispersion (range, variance, standard deviation, and skewness). These statistics provide a comprehensive overview of a data set's characteristics.
What is the mean and how is it calculated?
-The mean is a measure of central tendency that represents the mathematical average of a set of numbers. It is calculated by summing all the numbers in a range and then dividing by the count of all the numbers in that range.
Can you explain the median and its significance?
-The median is the middlemost number in a range of numbers when they are arranged from lowest to highest. It signifies the central value of the data set and is less affected by outliers compared to the mean.
What does the mode represent in a data set?
-The mode is the most frequently occurring number in a set of numbers. It represents the value that appears most often in the data set.
Why is it important to consider the shape of the data when using inferential statistics?
-The shape of the data, or its distribution, is important because it impacts the validity of inferential statistics. Certain tests assume specific data shapes, and if the data does not meet these assumptions, the results of the inferential tests may be meaningless.
How does skewness affect the interpretation of a data set?
-Skewness measures the degree of asymmetry of the distribution around its mean. It indicates whether the data leans to the left or right on a graph. Different combinations of mean, median, and mode can affect the skewness, which in turn influences how the data should be interpreted, especially in relation to inferential statistics.
What is the purpose of measures of dispersion in data analysis?
-Measures of dispersion, such as range, variance, and standard deviation, provide an indication of how spread out the data points are in relation to the mean. Understanding the dispersion is crucial for interpreting the measures of central tendency, especially the mean, within context.
How does the standard deviation help in interpreting the mean of a data set?
-Standard deviation, which is the square root of the variance, indicates the average distance of data points from the mean. It is expressed in the same unit as the original data, making it easier to interpret. Presenting standard deviation alongside the mean helps readers understand the spread of the data and interpret the mean within context.
Outlines
📊 Introduction to Descriptive Statistics
This paragraph introduces the concept of descriptive statistics, which are fundamental tools in quantitative analysis for summarizing and describing the basic features of a data set. Descriptive statistics provide a snapshot of the data's characteristics, helping to understand its shape and composition. Examples given include counts, percentages, and proportions derived from survey responses or sales data. The paragraph also distinguishes between descriptive and inferential statistics, with the former summarizing the data itself and the latter making predictions about a larger population based on sample data. The importance of descriptive statistics is highlighted for quickly identifying data issues and informing the decision-making process for inferential statistics.
📈 Understanding Measures of Central Tendency and Dispersion
The second paragraph delves into the 'big seven' descriptive statistics, categorized into measures of central tendency and dispersion. Measures of central tendency, including the mean, median, and mode, indicate the center of a data set and provide an idea of a 'typical' data point. The paragraph provides a practical example using service ratings from customers to illustrate how these measures can reveal overall customer sentiment. Additionally, the concept of skewness is introduced to explain the distribution shape of data, which is crucial for inferential statistics. The importance of understanding data shape is emphasized, as it impacts the choice and validity of inferential statistical methods.
📉 Exploring Measures of Dispersion and Their Implications
This paragraph focuses on measures of dispersion, which are essential for understanding the spread of data around the mean. The range, variance, and standard deviation are discussed as indicators of data spread, with higher values suggesting greater dispersion. The standard deviation is particularly highlighted for its ease of interpretation, as it is presented in the same unit as the original data. The paragraph uses a sample data set to demonstrate these concepts, showing how a high standard deviation indicates a more dispersed set of data. The importance of these measures is underscored for interpreting the mean within context and for guiding the application of inferential statistics.
🎓 Recap and Further Resources on Descriptive Statistics
The final paragraph provides a recap of the key points covered in the video script, emphasizing the essential role of descriptive statistics in quantitative data analysis. It summarizes the measures of central tendency (mean, median, mode), the concept of skewness, and measures of dispersion (range, variance, standard deviation). The paragraph encourages viewers to engage with the content by liking and subscribing and directs them to additional resources for learning more about quantitative data analysis. It also promotes a private coaching service for hands-on research guidance, concluding the video with an invitation to explore further and continue the learning journey.
Mindmap
Keywords
💡Descriptive Statistics
💡Inferential Statistics
💡Sample
💡Population
💡Measures of Central Tendency
💡Mean
💡Median
💡Mode
💡Skewness
💡Measures of Dispersion
💡Range
💡Variance
💡Standard Deviation
Highlights
Descriptive statistics are a way to summarize and describe basic features of a quantitative data set.
Descriptive statistics provide a snapshot of data set characteristics, aiding in understanding the data's shape.
Descriptive statistics include counts, percentages, and proportions to give insight into data composition.
Inferential statistics differ from descriptive by using sample data to make predictions about a larger population.
Descriptive statistics play a crucial role in identifying potential data set issues like outliers and missing responses.
Descriptives inform decision-making in inferential statistics by revealing the shape of the data.
The 'big seven' descriptive statistics include measures of central tendency and dispersion.
Measures of central tendency describe the center of a data set, indicating a typical data point.
Mean, median, and mode are the three common measures of central tendency.
Mean is the mathematical average of a set of numbers, median is the middle number, and mode is the most frequent.
Skewness measures the lean of data distribution to the left or right.
Measures of dispersion indicate how tightly or loosely data clusters around the mean.
Range, variance, and standard deviation are measures of dispersion.
High range indicates the possibility of data being spread out, but outliers could be the cause.
Variance measures the average of squared differences from the mean, indicating data spread.
Standard deviation is the square root of variance, making it easier to interpret in the same unit as the data.
Descriptive statistics are essential for interpreting central tendency measures within context.
Understanding dispersion helps in interpreting mean with caution, especially with high dispersion values.
Descriptive statistics inform what can be done with inferential statistics based on data shape.
Transcripts
Browse More Related Video

Introduction to Descriptive Statistics
Descriptive Statistics vs Inferential Statistics | Measure of Central Tendency | Types of Statistics

Descriptive Statistics [Simply explained]

Elementary Stats Lesson #3 A

What is Descriptive Statistics? A Beginner's Guide to Descriptive Statistics!
Introduction to Statistics (1.1)
5.0 / 5 (0 votes)
Thanks for rating: