What Partial Derivatives Are (Hands-on Introduction) — Topic 67 of Machine Learning Foundations
TLDRThe video script offers an in-depth introduction to partial derivatives, a concept pivotal in multivariate calculus and machine learning. It employs a visual approach, using colorful examples, Python code demonstrations, and interactive 3D curve plotting to simplify the subject. The script explains multivariate functions, where multiple variables like 'm' and 'b' in a regression equation influence the outcome 'y'. Partial derivatives allow for the calculation of these functions' rates of change with respect to each variable individually, treating the others as constants. The video uses the function z = x^2 - y^2 to illustrate this, showing how to calculate and interpret the partial derivatives with respect to both 'x' and 'y'. It also demonstrates how to plot these derivatives and the resulting tangent lines at various points on the curve, providing a clear understanding of how the slope of the function changes with the variables. The script concludes with an invitation to engage with further exercises and subscribe for more content, emphasizing the practical application of these mathematical tools in machine learning.
Takeaways
- 📈 Partial derivatives are essential for understanding multivariate functions, which are common in fields like machine learning.
- 🧮 Multivariate functions, such as y = mx + b, involve multiple variables influencing the outcome, necessitating the use of partial derivatives to isolate the effect of each variable.
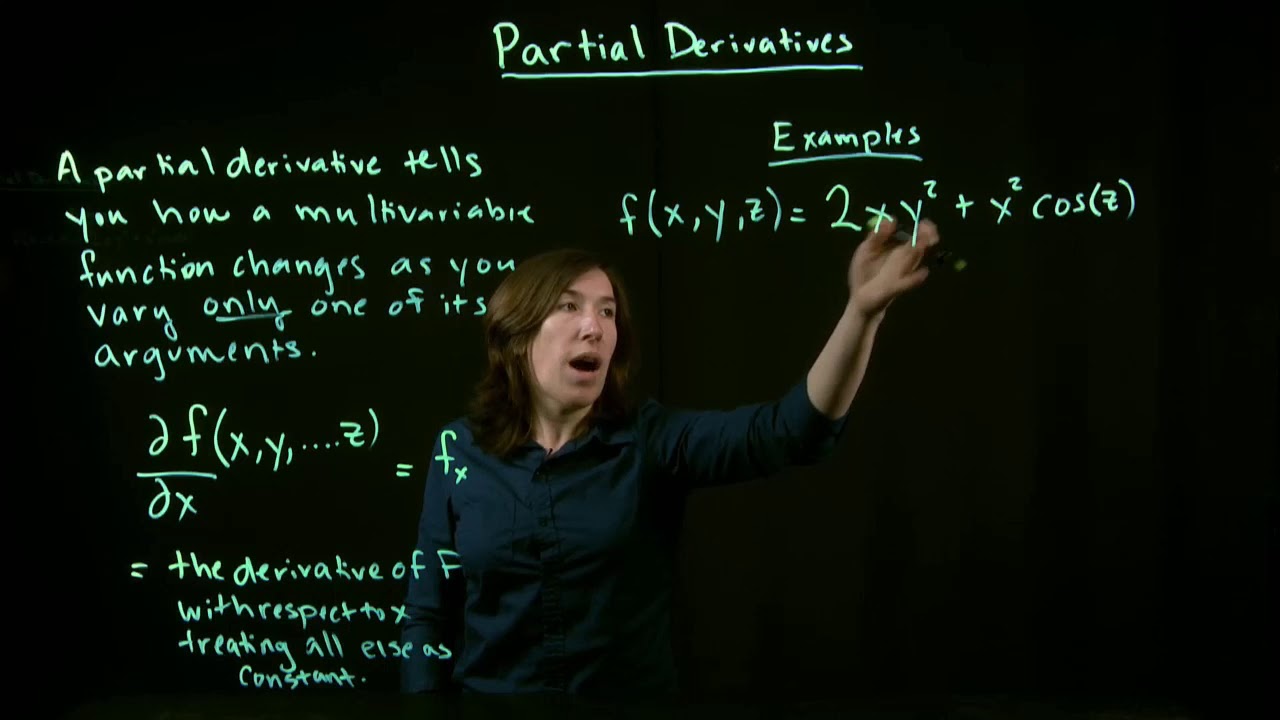
- 📊 The partial derivative of a function with respect to one variable treats all other variables as constants, allowing for the calculation of the rate of change along a specific axis.
- 🌐 GeoGebra is a useful tool for visualizing multivariate functions and their partial derivatives in three dimensions.
- 💡 The partial derivative symbol, denoted by the curly d (∂), was introduced by the philosopher and mathematician Nicolas de Condorcet in 1770.
- 📌 The partial derivative of z with respect to x in the function z = x^2 - y^2 is ∂z/∂x = 2x, indicating that the slope of z with respect to x is twice the value of x.
- 📉 For the same function z = x^2 - y^2, the partial derivative with respect to y is ∂z/∂y = -2y, showing an inverse relationship between z and y.
- 👉 The slope of the tangent line to the curve of a multivariate function at any point can be found using the partial derivative at that point.
- 🌟 The value of the partial derivative can change the shape of the tangent line at different points along the curve, reflecting the local behavior of the function.
- 🔢 In Python, libraries like NumPy and Matplotlib can be used to calculate and visualize partial derivatives and their corresponding tangent lines.
- 📚 Hands-on coding demonstrations, such as those using Jupyter notebooks, are effective for understanding the practical application of partial derivatives in machine learning.
Q & A
What is the main focus of the video?
-The video focuses on introducing partial derivatives in a comprehensive and visual manner, using examples, code demos in Python, and interactive curve plotting tools.
Why are partial derivatives important in the context of machine learning?
-Partial derivatives are important in machine learning because they allow us to calculate derivatives of multivariate functions, which are common in machine learning, including in simple regression models where the outcome is influenced by multiple variables.
What is the multivariate function used as an example in the video?
-The multivariate function used as an example in the video is z = x^2 - y^2, which is a simple function of two variables, x and y.
How does the video use GeoGebra to help understand the concept of partial derivatives?
-The video uses GeoGebra, a 3D graphing tool, to create and visualize the curve of the multivariate function. This allows viewers to observe the curve from different dimensions and understand how the outcome (z) is influenced by varying one variable while holding the other constant.
What is the partial derivative of z with respect to x in the given example?
-The partial derivative of z with respect to x, denoted as del z/del x, is 2x. This means that the slope of z along the x-axis is twice the value of x at any given point.
What does the symbol ∂ represent in mathematics?
-The symbol ∂, known as the 'curly d' or 'del', represents a partial derivative in mathematics. It was introduced by the philosopher and mathematician Nicole de l'Hôpital in 1770.
How does the video demonstrate the concept of the slope of a curve?
-The video demonstrates the concept of the slope of a curve by showing how the slope changes with different values of x and y. It uses the partial derivatives of z with respect to x and y to show how the slope varies and how it can be visualized on a graph.
What is the relationship between the slope of z with respect to y and the value of y?
-The slope of z with respect to y, denoted as del z/del y, is -2y. This means that the slope is twice the value of y but with an inversion, resulting in a parabolic curve that opens downward.
How does the video use Python code to illustrate the concept of partial derivatives?
-The video uses Python code to define the multivariate function, calculate partial derivatives, and plot the function and its tangent lines at various points. This hands-on coding approach helps to visualize and understand how partial derivatives work in practice.
What is the significance of the 'point and tangent with respect to x' function in the code demo?
-The 'point and tangent with respect to x' function is used to calculate and plot both a specific point on the curve and the tangent line at that point, based on a given x value. This helps to visualize the slope of the curve at different points.
How does the video address the concept of holding one variable constant while varying another?
-The video addresses this concept by showing how to calculate and visualize the partial derivatives when one variable is held constant. For example, it demonstrates how the slope of z with respect to x is calculated when y is treated as a constant.
Outlines
📈 Introduction to Partial Derivatives
The video begins with an introduction to partial derivatives, emphasizing their importance in understanding multivariate functions common in machine learning. The presenter uses a combination of visual aids, Python code demos, and interactive curve plotting to simplify the subject. The need for partial derivatives arises when dealing with functions influenced by multiple variables, such as in regression models. The video uses the example of the multivariate function z = x² - y² to illustrate how partial derivatives can calculate the rate of change with respect to each variable individually.
🔢 Calculating Partial Derivatives
The second paragraph delves into the calculation of partial derivatives. It explains the process of treating one variable as constant while finding the derivative with respect to another. The video uses the function z = x² - y² to demonstrate how to find the partial derivative of z with respect to x (∂z/∂x) by considering y as a constant. The resulting derivative, 2x, indicates that the slope of z with respect to x at any point is twice the value of x. The video also discusses the historical context of the 'curly d' notation for partial derivatives, introduced by French mathematician and philosopher Nicolas de Condorcet.
📊 Plotting Partial Derivatives with Python
This paragraph focuses on the practical demonstration of plotting partial derivatives using Python. It guides viewers through the process of creating a plot that visualizes the function z = x² - y² and its partial derivative with respect to x. The video uses libraries such as numpy, matplotlib, and pi torch to generate a range of x values, calculates the corresponding z values, and plots the curve. It also introduces a function to calculate and plot the tangent line at specific points on the curve, demonstrating the slope of the function at those points.
🎨 Visualizing Tangent Lines and Partial Derivatives
The fourth paragraph describes a custom function for plotting points and their respective tangent lines on the curve of the function z = x² - y². The function takes various inputs, including the curve, specific x and y values, the function itself, its derivative, and a color for the plot. The video demonstrates how to calculate the slope (m) and y-intercept (b) of the tangent line at a given point and how to overlay these tangent lines on the curve for visual comparison. This visual approach helps to clarify the concept of partial derivatives and their application.
🔍 Examining the Partial Derivative with Respect to y
The video shifts its focus to the partial derivative of z with respect to y (∂z/∂y). It uses the same function z = x² - y², but this time considers x as a constant. The presenter explains that the partial derivative with respect to y is -2y, indicating that the slope of z along the y-axis is negative twice the value of y. This results in a downward-opening parabola as y increases. The video also revisits the GeoGebra demo to visually show this relationship and reinforces the concept that the slope of z with respect to y is independent of the x value.
📚 Final Thoughts and Next Steps
In the final paragraph, the presenter wraps up the discussion on partial derivatives and invites viewers to engage with additional exercises for a deeper understanding. They also encourage subscription to the channel for upcoming videos in the series. The presenter provides information on how to stay connected through various platforms, including email newsletters, LinkedIn, and Twitter, offering a comprehensive support network for those interested in the machine learning foundation series.
Mindmap
Keywords
💡Partial Derivatives
💡Multivariate Functions
💡Machine Learning
💡GeoGebra
💡Python
💡Numpy and Matplotlib
💡Pi Torch
💡Interactive Plotting
💡Saddle Shape
💡Tangent Line
💡Derivative Notation
Highlights
The video serves as a comprehensive introduction to partial derivatives, aiming to simplify a potentially complex subject.
Partial derivatives are essential for understanding multivariate functions, which are common in fields like machine learning.
The video uses a highly visual approach with colorful examples, code demos in Python, and interactive curve plotting tools.
Multivariate functions, such as y = mx + b, involve multiple variables influencing the outcome, necessitating the use of partial derivatives.
The concept of partial derivatives allows for the calculation of derivatives of multivariate functions, extending beyond univariate functions.
The function z = x^2 - y^2 is used as a simple multivariate function example, illustrating a saddle shape curve.
GeoGebra.org is utilized for a hands-on code demo to create and visualize the multivariate function curve from different dimensions.
Partial derivatives enable the calculation of the slope of the curve z at any point with respect to x or y, considering the other variable as constant.
The partial derivative notation uses a curly d symbol (∂), introduced by French mathematician and philosopher Nicole de l'Hôpital.
The slope of z with respect to x is 2x, indicating that the slope is twice the value of x at any given point on the curve.
A hands-on code demo using GitHub and Colab is provided to create a chart that visualizes the function and its partial derivatives.
The video demonstrates how to calculate and plot the tangent line of the curve at specific points using the slope from the partial derivative.
The partial derivative of z with respect to y is -2y, showing an inverse relationship between z and y, with the curve opening downward.
The video emphasizes that the slope of z with respect to y is independent of x, maintaining the same regardless of x's value.
The practical application of partial derivatives is showcased through coding examples, enhancing the understanding of their role in machine learning.
Exercises are provided at the end of the tutorial for further practice and comprehension of partial derivatives.
The tutorial concludes with options to subscribe to the channel, sign up for an email newsletter, and connect on social media for further learning opportunities.
Transcripts


5.0 / 5 (0 votes)
Thanks for rating: