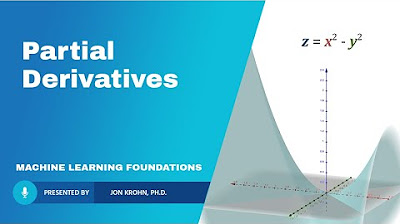
Partial derivatives and graphs
TLDRThis video script offers an insightful exploration of partial derivatives in the context of a two-variable function, f(x, y) = x^2 * y + sin(y). It explains how to interpret the partial derivative at a specific point, treating the other variable as constant. The script visually demonstrates the concept by slicing the graph at y=1 and x=-1, illustrating how the partial derivative represents the slope of the tangent line to the function at that point. It also covers the partial derivative with respect to y, providing a clear understanding of how the function changes with respect to each variable. The importance of visualizing partial derivatives through graphs is emphasized, while also acknowledging that graphs are not the sole method for interpretation.
Takeaways
- 📚 The video discusses the concept of partial derivatives of a two-variable function, specifically f(x, y) = x^2 * y + sin(y).
- 🔍 The partial derivative with respect to x is interpreted by considering y as a constant, which simplifies the function to 2xy for differentiation.
- 📌 Evaluating the partial derivative at the point (-1, 1) yields a result of -2, indicating the slope of the tangent line to the function at that point.
- 📈 The process of taking a partial derivative involves 'slicing' the graph with a plane at a constant y-value, which helps visualize the change in the function as x varies.
- 📉 The interpretation of the partial derivative as a slope is analogous to the concept of slope from single-variable calculus, representing the rate of change of the function.
- 📊 The video uses a graphical approach to explain the concept, emphasizing the visual representation of the function and its tangent lines.
- 👉 The partial derivative with respect to y is calculated by considering x as a constant, resulting in the derivative being x^2 + cos(y).
- 🔢 When evaluated at the point (-1, 1), the partial derivative with respect to y suggests a slope slightly greater than 1, indicating the rate of change in the y direction.
- 🤔 The video acknowledges that while graphs are useful for visualizing partial derivatives, they are not the only method and should not limit understanding.
- 🌐 The script hints at future discussions on partial derivatives in the context of vector-valued functions and higher-dimensional inputs, expanding on the concept beyond two-variable functions.
Q & A
What is the function f(x, y) presented in the script?
-The function f(x, y) is defined as f(x, y) = x^2 * y + sin(y).
What does taking the partial derivative of a function with respect to x mean?
-Taking the partial derivative of a function with respect to x means differentiating the function while treating all other variables, in this case y, as constants.
How is the partial derivative of f(x, y) with respect to x calculated?
-The partial derivative of f(x, y) with respect to x is calculated as ∂f/∂x = 2xy, treating y as a constant during the differentiation process.
What is the value of the partial derivative of f(x, y) with respect to x at the point (-1, 1)?
-At the point (-1, 1), the value of the partial derivative of f(x, y) with respect to x is -2, as it is 2 * (-1) * 1.
What does the partial derivative represent on the graph of a function?
-The partial derivative represents the slope of the tangent line to the function at a specific point when considering a small change in the variable with respect to which the derivative is taken.
How does treating y as a constant affect the interpretation of the partial derivative with respect to x?
-Treating y as a constant effectively slices the graph along a plane where y has a constant value, allowing us to analyze the slope of the function along that slice in the x-direction.
What does the script suggest about the usefulness of graphs in understanding partial derivatives?
-The script suggests that graphs are very useful for visualizing and understanding the concept of partial derivatives, especially in the context of functions with two-variable inputs and one-variable output.
What is the process of finding the partial derivative with respect to y?
-The process involves differentiating the function with respect to y while treating all other variables, in this case x, as constants. For the given function, it would be ∂f/∂y = x^2 + cos(y).
How does the script describe the concept of 'slices' in the context of partial derivatives?
-The script describes 'slices' as planes that cut through the graph at a constant value of one variable, allowing us to analyze the slope of the resulting curve or line for the other variable.
What is the general interpretation of a partial derivative in the context of the script?
-The general interpretation of a partial derivative is the rate of change of the function in the direction of one variable, holding all other variables constant, which can be visualized as the slope of a tangent line to the graph at a specific point.
What does the script imply about the limitations of using graphs to understand partial derivatives?
-The script implies that while graphs are handy for visualizing partial derivatives in two-variable functions, they may not be the only or the best method for understanding partial derivatives in more complex contexts, such as functions with multidimensional outputs or many inputs.
Outlines
📈 Understanding Partial Derivatives on a Graph
The first paragraph introduces the concept of partial derivatives in the context of a two-variable function, f(x, y) = x^2 * y + sin(y). The focus is on interpreting the partial derivative of f with respect to x at the point (-1, 1). The explanation involves considering y as a constant and differentiating the function to find the slope at the given point, which is -2. This is visualized by slicing the graph with a plane at y = 1, representing a constant y value, and observing the slope of the resulting line on the graph.
🔍 Exploring the Slope of a Function with Partial Derivatives
The second paragraph delves deeper into the concept of partial derivatives, this time with respect to y, for the same function. It explains the process of evaluating the partial derivative at the point (-1, 1), resulting in an expression involving x^2 and cos(y). The paragraph discusses the interpretation of this derivative as the slope of the curve obtained by slicing the graph at x = -1. It also touches on the broader concept of partial derivatives in various mathematical contexts, including multidimensional outputs and functions with many inputs, emphasizing the importance of understanding the change in output relative to a small change in input, visualized as the slope of the tangent line.
Mindmap
Keywords
💡Partial Derivative
💡Two-Variable Function
💡Graph Interpretation
💡Slope
💡Constant Y Value
💡Differentiation
💡Tangent Line
💡Sine Function
💡Cosine Function
💡Vector-Valued Function
Highlights
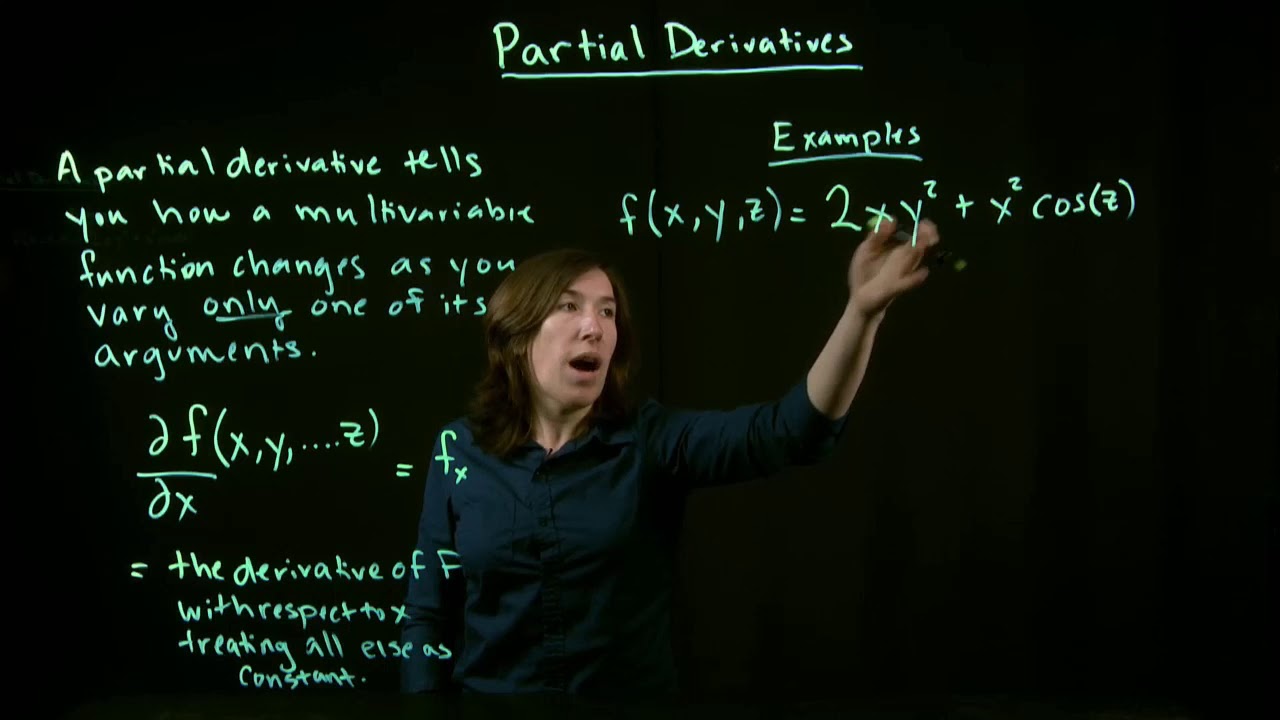
Introduction to interpreting the partial derivative of a two-variable function.
The function f(x, y) = x^2 * y + sin(y) is presented for analysis.
Explanation of taking the partial derivative of f with respect to x at a specific point (-1, 1).
Identification of the point (-1, 1) on the graph.
Concept of treating y as a constant when taking the partial derivative with respect to x.
Differentiation of x^2 and treating sine of y as a constant to find the partial derivative.
Evaluation of the partial derivative at x = -1 and y = 1, resulting in -2.
Interpretation of the partial derivative as a slope on the graph.
Visualization of slicing the graph with a plane at a constant y value.
Explanation of the slope as the rate of change of the function in the x direction.
Graphical representation of the tangent line corresponding to the slope.
Transition to taking the partial derivative with respect to y.
Slicing the graph with a plane at a constant x value to analyze the partial derivative with respect to y.
Differentiation of x^2 * y and sin(y) to find the partial derivative with respect to y.
Evaluation of the partial derivative at the point (-1, 1), resulting in a positive value.
Discussion on the practical applications and limitations of using graphs to interpret partial derivatives.
Emphasis on the importance of understanding the concept of partial derivatives beyond graphical interpretation.
Anticipation of future discussions on multidimensional outputs and vector-valued functions.
Conclusion highlighting the usefulness of graphs for understanding two-variable functions.
Transcripts
Browse More Related Video


5.0 / 5 (0 votes)
Thanks for rating: