Inequalities with Functions - Graphically (Precalculus - College Algebra 45)
TLDRThis video script delves into the intersection of functions and inequalities, specifically focusing on how to graphically interpret and algebraically solve for when a function is greater than, less than, equal to, or not equal to zero. The host illustrates the concept by comparing the function's graph to the x-axis, using interval notation to denote where the function's output is positive, negative, or zero. The explanation covers various scenarios, including polynomial and rational functions, and addresses the nuances of using brackets and parentheses in interval notation. The script emphasizes the importance of understanding the x-axis's role in determining the function's behavior and provides a foundation for further exploration into inequalities involving functions.
Takeaways
- 📈 The main focus is on understanding how to compare functions to the x-axis in terms of inequalities, determining when a function is greater than, less than, equal to, or not equal to zero.
- 📌 To find where a function is greater than or equal to zero, look for portions of the x-axis where the graph is above or on the x-axis.
- 📊 Use interval notation to express the portions of the x-axis where the function meets the inequality conditions, with brackets for included points and parentheses for excluded points.
- 🚫 Remember that vertical asymptotes and points where the function is undefined are not included in the intervals, even if an equality is present.
- 🔍 For rational functions, be cautious with asymptotes; they affect how intervals are notated and understood in the context of the inequality.
- 🛑 An open circle or parenthesis is used in interval notation when the function's value at a point does not exist or is undefined.
- ➡️ When the function is asked to be strictly greater than zero, ensure that the graph is above the x-axis without including any x-intercepts.
- 🔁 For inequalities involving less than or equal to zero, identify the intervals where the function's output is negative or the graph is below the x-axis.
- ✅ X-intercepts are included in the intervals when the function is equal to zero, as they represent points on the x-axis where the output is zero.
- 🔢 Polynomial functions are continuous and do not have jumps or gaps, which makes identifying intervals for inequalities somewhat straightforward.
- 📐 Horizontal asymptotes can affect the interpretation of intervals for rational functions, but the focus remains on the x-axis and the function's relationship to it.
Q & A
What is the main focus of the video script?
-The video script focuses on understanding and working with functions and inequalities, particularly how to graphically interpret and algebraically deal with polynomials and rationals in the context of inequalities.
How does the script define the portion of the x-axis where a function is greater than or equal to zero?
-The script defines it as the portion of the x-axis where the function's graph is above the x-axis or on the x-axis, which corresponds to the function's outputs being greater than or equal to zero.
What is the significance of using interval notation in the context of the script?
-Interval notation is used to express the portions of the x-axis where specific conditions about the function's relationship to the x-axis are met, such as being greater than, less than, or equal to zero.
How does the script differentiate between using brackets and parentheses in interval notation?
-The script indicates that brackets are used when the function includes the point on the x-axis (when there is an equality), while parentheses are used when the point on the x-axis is not included, such as at vertical asymptotes or when the function is strictly greater or less than zero.
What is the role of the x-axis in determining the intervals for the function's inequalities?
-The x-axis serves as a reference to identify the intervals where the function's graph is above, below, or on the x-axis, which helps in determining the function's behavior in relation to the given inequalities.
How does the script handle vertical asymptotes when discussing inequalities?
-The script emphasizes that vertical asymptotes, which are undefined points, cannot be included in the intervals even if there is an equality sign in the inequality. Instead, parentheses are used to indicate that the value is not included in the interval.
What is the difference between a vertical asymptote and a horizontal asymptote in the context of the script?
-A vertical asymptote is a point where the function is undefined and thus cannot be included in any intervals, even if an equality is present in the inequality. A horizontal asymptote, on the other hand, represents a value that the function's output approaches but does not necessarily equal, which can affect the intervals where the function's graph is above or below the x-axis.
How does the script suggest approaching the problem of finding where a function is strictly positive?
-The script suggests looking for intervals on the x-axis where the function's graph is strictly above the x-axis, ensuring not to include any points where the function is undefined or equal to zero, using parentheses to denote these exclusions.
What is the importance of understanding the x-intercepts in the context of inequalities?
-X-intercepts are points where the function's output is zero and can be included in the intervals when the inequality allows for equality. They are important because they represent points where the function's graph intersects the x-axis and can affect the solution to the inequality.
How does the script handle the transition from discussing polynomials to rationals in inequalities?
-The script transitions by emphasizing that while the approach to finding intervals remains the same, rational functions can introduce additional complexity due to the presence of asymptotes, which require careful consideration when applying interval notation.
What advice does the script give for solving inequalities involving functions?
-The script advises maintaining a clear mental picture of the x-axis and how the function's graph relates to it, using interval notation to express the solutions, and being cautious with the inclusion or exclusion of points on the x-axis based on the presence of asymptotes or the nature of the inequality.
Outlines
📈 Understanding Functions and Inequalities
This paragraph introduces the topic of functions and inequalities, focusing on how to algebraically and graphically interpret when a function is greater than, less than, equal to, or not equal to zero. The key is to identify the intervals along the x-axis where the function's output is above or below the x-axis. The explanation includes the use of interval notation and the importance of including or excluding certain points based on whether they are part of the function's graph or represent asymptotes.
📌 Interval Notation and Function Graphs
The paragraph explains the use of interval notation when determining where a function's graph is above or below the x-axis. It clarifies when to use brackets and parentheses, emphasizing that brackets are used when the function includes the x-axis (outputs are zero), while parentheses are used for intervals that do not include the x-axis. The concept is illustrated with examples, highlighting how to interpret the function's behavior between specific points on the x-axis.
🔍 Dealing with Polynomials and Rational Functions
This section discusses how to apply the same principles of interval notation to polynomial and rational functions. It highlights the importance of considering asymptotes when dealing with rational functions, as they affect the intervals where the function is defined and can cause confusion. The paragraph provides a step-by-step approach to identifying intervals for functions that are strictly negative or positive, taking into account the behavior of the function at asymptotes.
🚫 Excluding Undefined Points in Intervals
The focus of this paragraph is on how to handle undefined points in functions, particularly at vertical asymptotes. It stresses that even if an interval notation includes an equality (indicating the function is on the x-axis), undefined points such as vertical asymptotes must be excluded. The explanation includes how to correctly use parentheses to indicate intervals that approach but do not include undefined points, ensuring accurate representation of the function's behavior.
🔢 Applying the Concept to Polynomials and Rational Functions
The final paragraph reiterates the process of identifying intervals for functions above or below the x-axis, with an emphasis on the challenges presented by horizontal and vertical asymptotes. It provides a method to determine where a function is strictly positive or negative, considering the continuity of polynomials and the discontinuities of rational functions. The summary encourages viewers to practice identifying these intervals, reinforcing the importance of understanding the x-axis's role in function analysis.
Mindmap
Keywords
💡Functions
💡Inequalities
💡Graphs
💡Polynomials
💡Rationals
💡Asymptotes
💡Interval Notation
💡X-axis
💡Graph Interpretation
💡Brackets and Parentheses
💡Undefined Points
Highlights
The video series focuses on the intersection of functions and inequalities, specifically how to algebraically and graphically handle polynomials and rationals in the context of inequalities.
The importance of understanding the comparison of a function to the x-axis is emphasized, such as determining when a function is greater than, less than, or equal to zero.
Graphical representation is introduced as a method to visualize and solve inequalities involving functions.
Interval notation is explained, detailing when to use brackets and parentheses based on the presence or absence of equal signs in the function's relationship to the x-axis.
The concept of asymptotes in rational functions is discussed, and how they affect interval notation and the inclusion or exclusion of certain points.
The video provides a clear distinction between when to include points on the x-axis (using brackets) and when to exclude them (using parentheses) in interval notation.
The use of open circles and asymptotes in graphical representations is explained to indicate points that do not exist in the function's domain.
Examples involving polynomials and rationals are used to illustrate the process of determining intervals where the function's output is above or below the x-axis.
The video emphasizes the continuous nature of polynomials and the handling of horizontal and vertical asymptotes in rational functions.
The process of identifying intervals for functions that are strictly positive or strictly negative is demonstrated with clear examples.
The video explains how to interpret inequalities in terms of functions, focusing on the x-axis and the resulting outputs.
The concept of x-intercepts and their inclusion in interval notation is discussed, highlighting the conditions under which they are considered part of the solution set.
The video concludes with a teaser for upcoming content on inequalities of polynomials and rational functions, promising a deeper exploration of these concepts.
Throughout the video, the presenter uses a step-by-step approach to break down complex mathematical concepts into understandable segments.
The importance of understanding the independent variable 'x' and its role in driving the function is highlighted.
The video provides a comprehensive guide on how to interpret and apply inequalities to functions, offering both theoretical and practical insights.
The presenter uses visual aids effectively to enhance the understanding of how functions relate to the x-axis and how to represent this relationship using inequalities.
Transcripts
Browse More Related Video

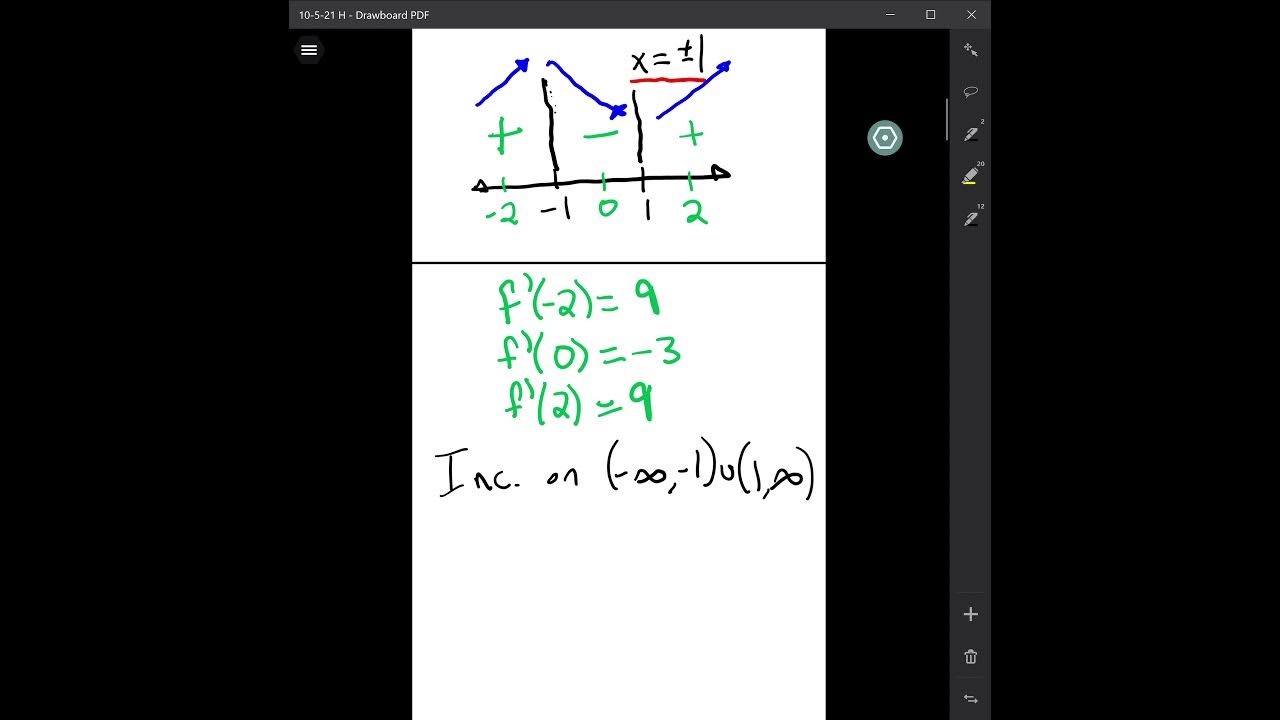
Increasing, Decreasing, Positive, Negative Function Intervals
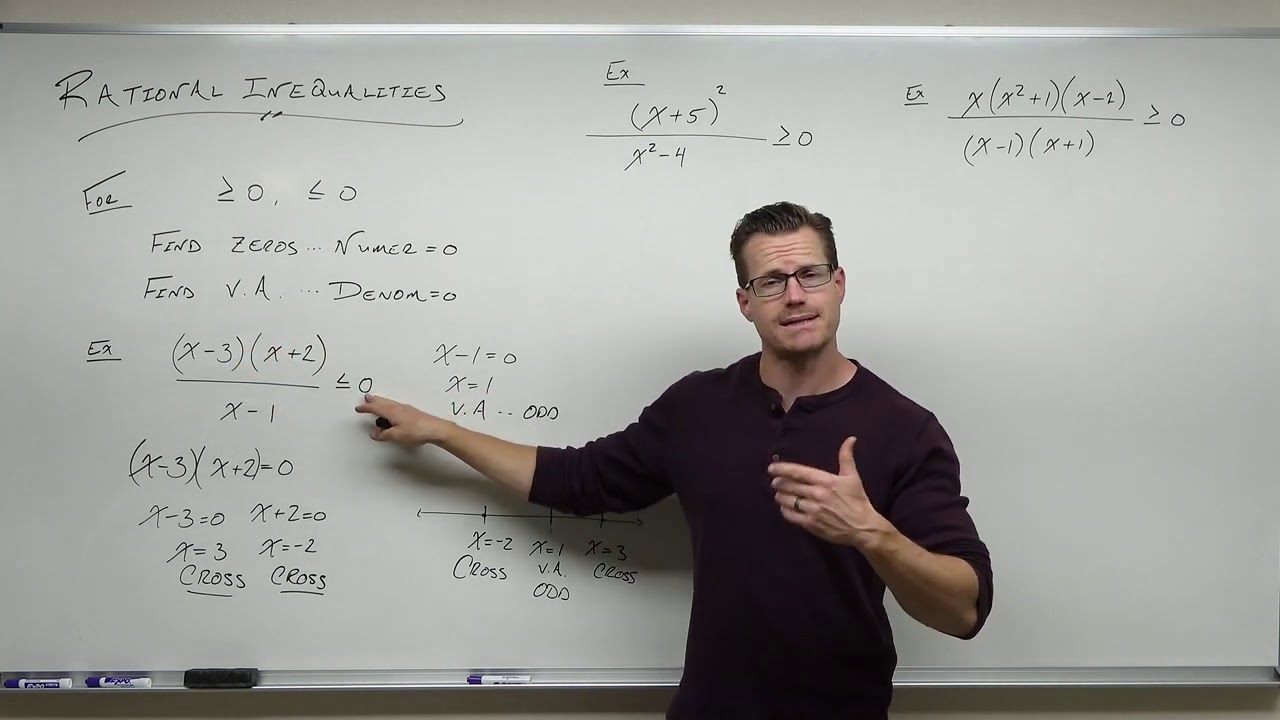
Inequalities with Rational Functions (Precalculus - College Algebra 47)
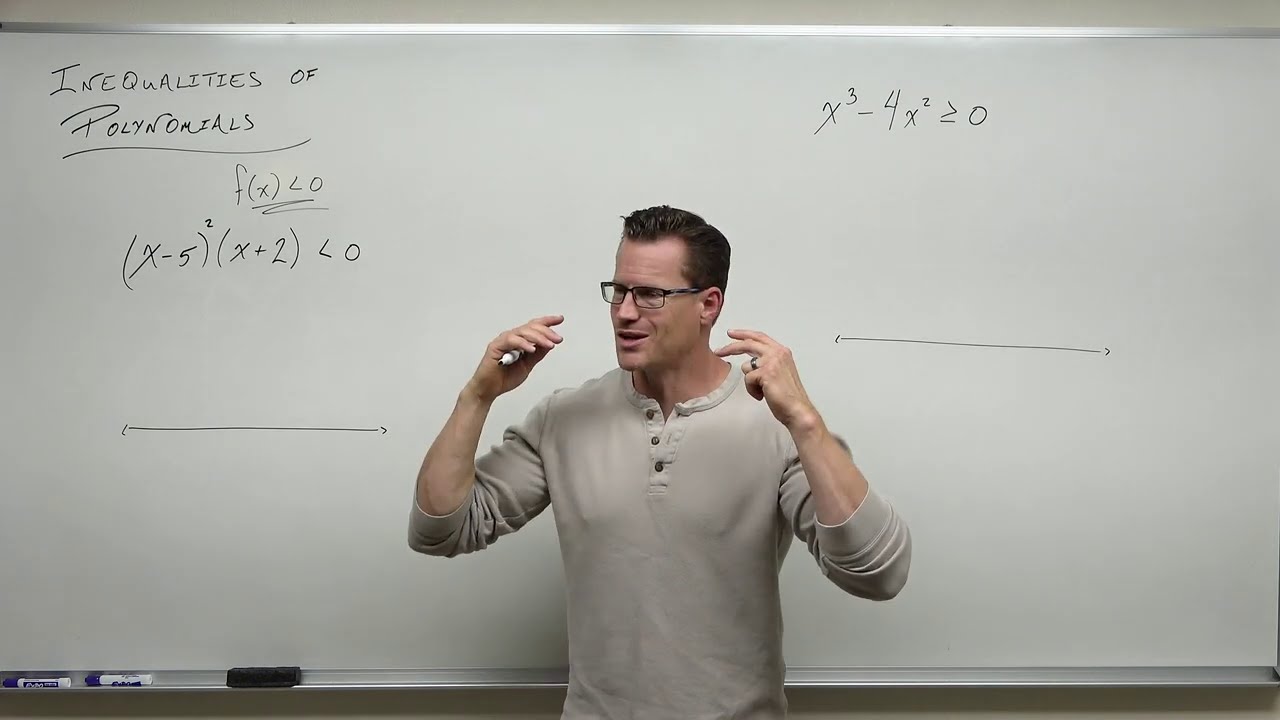
Inequalities with Polynomial Functions (Precalculus - College Algebra 46)

1.2 - Algebraic Limits and Continuity
Relative Maxima/Minima Examples
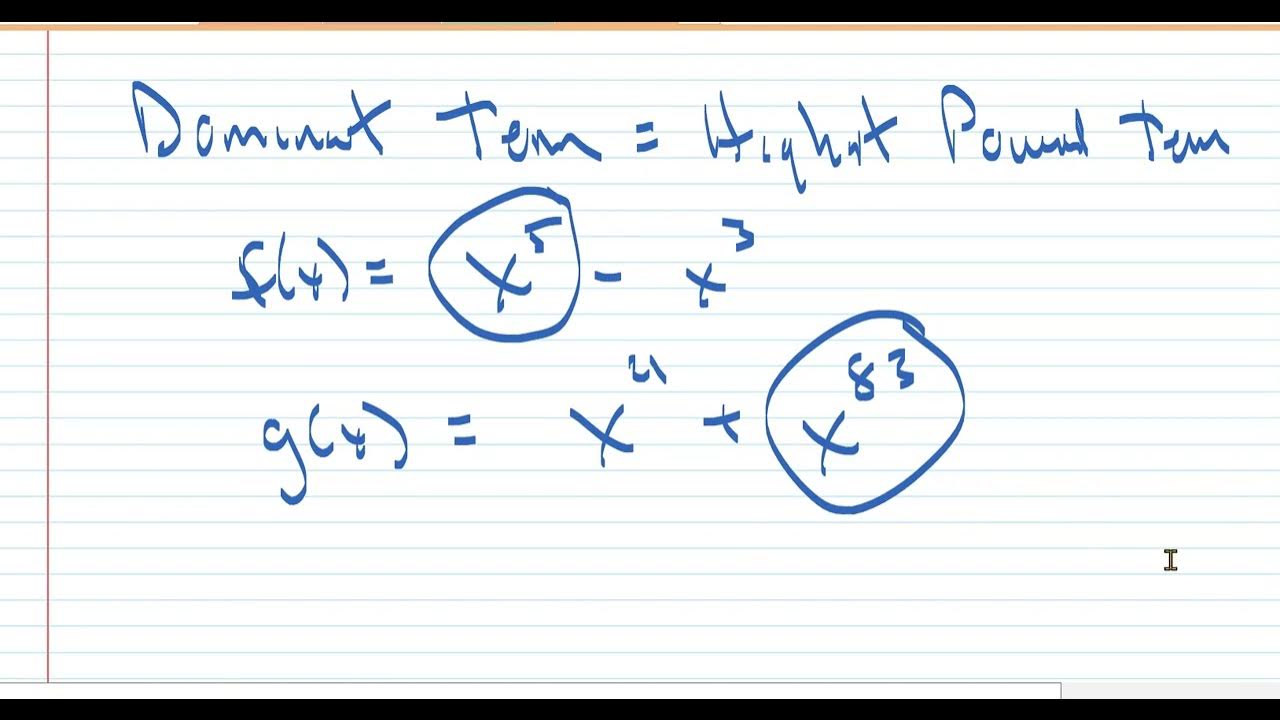
Calculus:Limits of Rational Functions
5.0 / 5 (0 votes)
Thanks for rating: