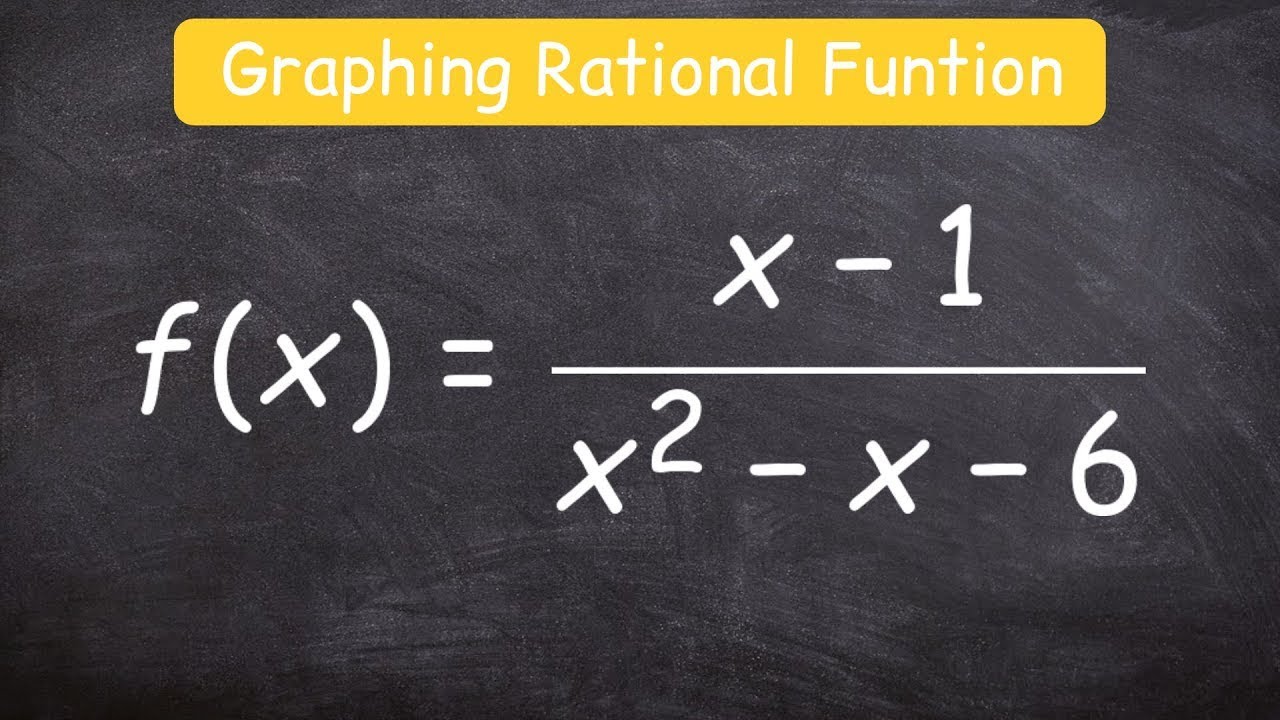
Graphing Rational Functions (Precalculus - College Algebra 44)
TLDRThis comprehensive video script delves into the intricacies of graphing rational functions, a topic of significant interest in mathematics. The presenter meticulously guides viewers through a step-by-step process to understand and visualize these functions. Starting with identifying horizontal and oblique asymptotes, the script emphasizes the importance of factoring both the numerator and denominator to locate discontinuities, vertical asymptotes, and potential holes in the graph. Each step is methodically explained, from finding x and y-intercepts to evaluating the function at specific points for a more precise graph. The script also addresses special cases, such as functions with even multiplicity vertical asymptotes and those that bounce off the x-axis. The presenter adeptly handles the complexity of the topic, making it accessible to learners, and encourages a deeper understanding of the subject by connecting back to previously learned concepts. This script is not only an educational resource but also a testament to the presenter's ability to simplify and communicate advanced mathematical ideas effectively.
Takeaways
- 📈 To graph rational functions, first determine the end behavior, which could be a horizontal or oblique asymptote, or end behavior that resembles a power function.
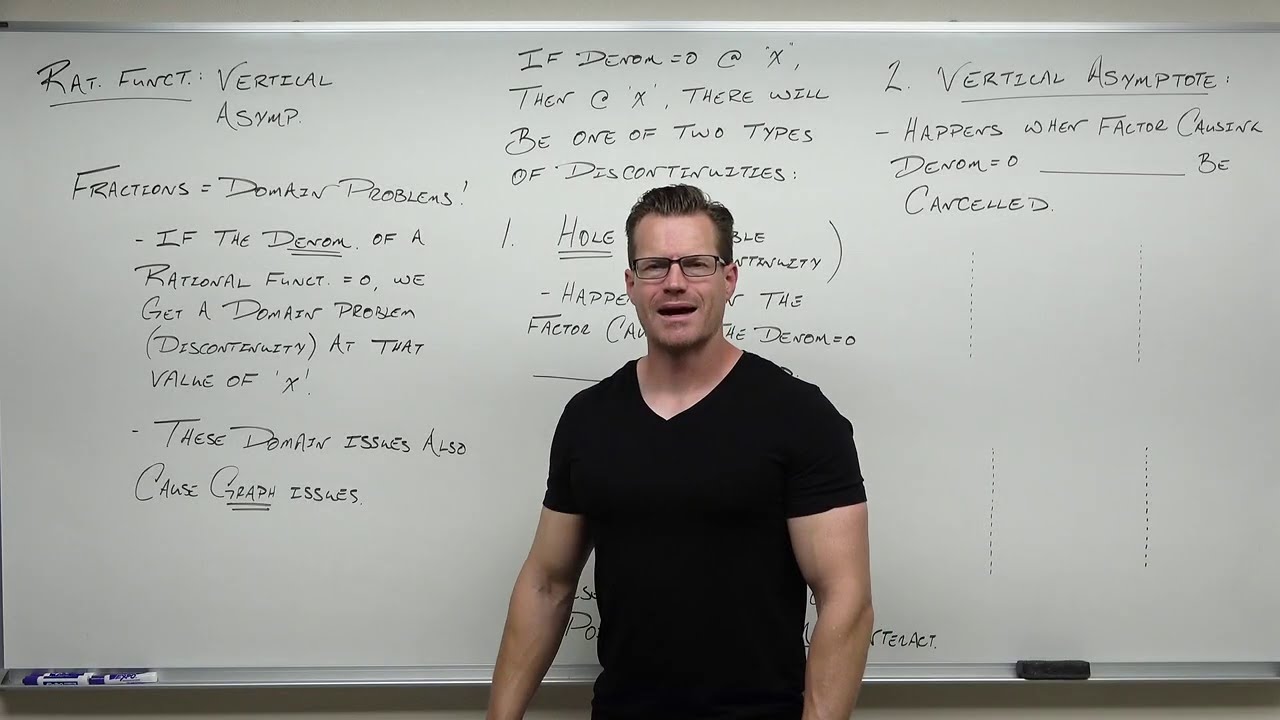
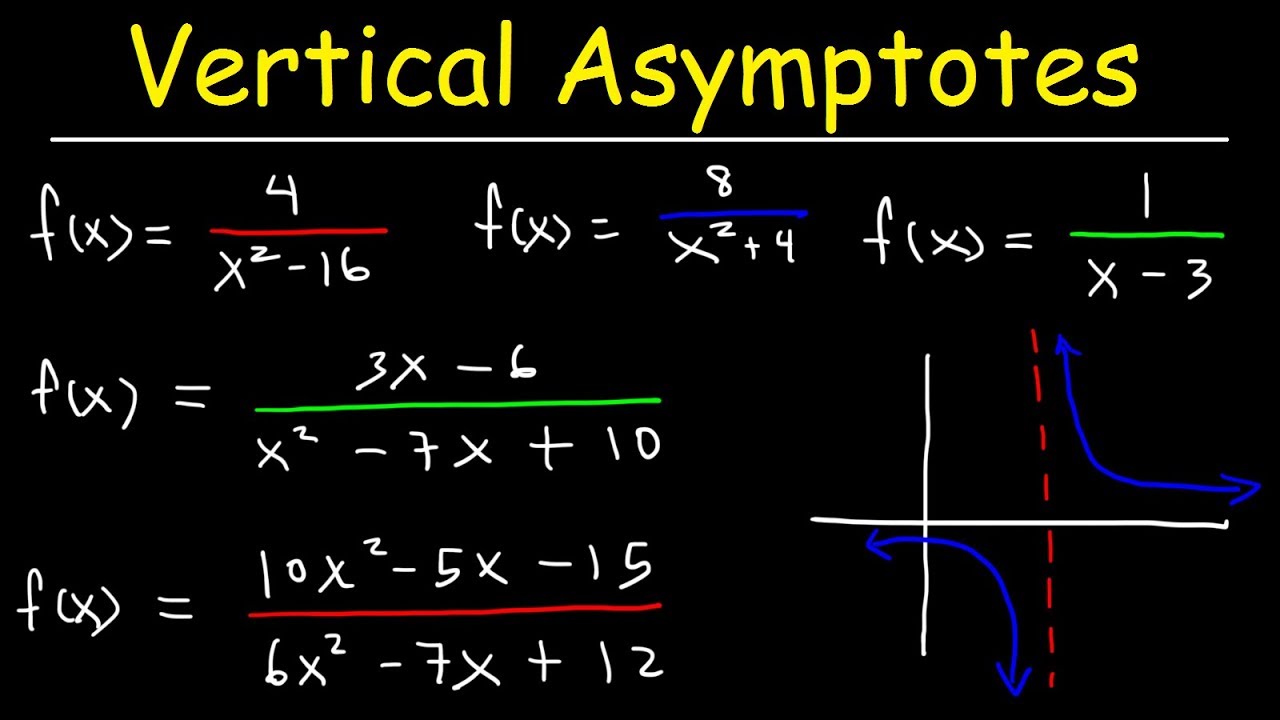
- 🔍 Identify vertical asymptotes by setting the denominator equal to zero and checking for factors that do not cancel out from the numerator.
- 🔗 Use the zero product property to find x-intercepts by setting the factored numerator equal to zero.
- 📍 Determine if x-intercepts are crosses or bounces based on the multiplicity of the factors (odd for crosses, even for bounces).
- 🏁 Find the y-intercept by substituting x with zero in the function and solving for the resulting value.
- ✏️ If a horizontal asymptote is present and it's not zero, set the function equal to the asymptote value to find potential intersections.
- 🔢 Use long division to find the oblique (slant) asymptote by dividing the numerator by the denominator twice.
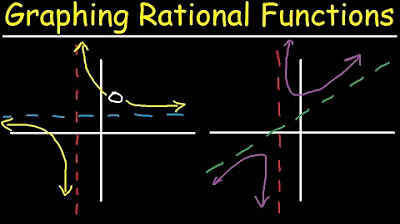
- 📊 Plot a number line with all relevant points, including vertical asymptotes, x-intercepts, and any additional points found through evaluation.
- 🔁 Remember that the graph of a rational function must interact with its asymptotes in a specific way, respecting their odd or even multiplicities.
- 💡 Evaluate additional points within each interval between asymptotes to refine the graph and ensure accuracy.
- 📋 When graphing, start with the horizontal asymptote, plot the vertical asymptotes, mark x-intercepts, and then add the y-intercept before connecting the points.
Q & A
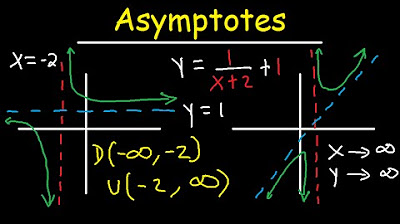
What are the three types of asymptotes that can be found when graphing rational functions?
-The three types of asymptotes are horizontal asymptotes, vertical asymptotes, and oblique (or slant) asymptotes.
How do you determine the end behavior of a rational function?
-You determine the end behavior by looking at the leading terms of the numerator and the denominator, putting them in a ratio, and simplifying to find what the function approaches as x goes to positive or negative infinity.
What is a hole in a rational function and how do you find it?
-A hole is a point on the graph where the function is undefined because the denominator equals zero but does not cancel out with a factor in the numerator. You find it by factoring the rational function and checking for factors in the denominator that do not cancel out with the numerator.
What is the significance of the multiplicity of an asymptote?
-The multiplicity of an asymptote indicates whether the graph will cross (odd multiplicity) or bounce (even multiplicity) at the asymptote. It helps to understand how the graph behaves near the asymptote.
How do you find the x-intercepts of a rational function?
-To find the x-intercepts, set the numerator of the rational function equal to zero and solve for x, as the x-intercepts occur where the function equals zero.
What is a y-intercept and how do you find it?
-A y-intercept is a point where the graph of the function crosses the y-axis. You find it by setting x equal to zero in the function and solving for y.
What is the purpose of evaluating extra points when graphing a rational function?
-Evaluating extra points helps to get a more accurate sketch of the graph by providing additional information about the function's behavior in different intervals.
Why is it important to graph the asymptotes and x-intercepts first when sketching a rational function?
-Graphing the asymptotes and x-intercepts first provides a framework for the graph, showing where the function cannot go and helping to determine the overall shape of the graph.
What does the script mean by 'fake distribution' when discussing end behavior?
-Fake distribution refers to the process of looking at the leading terms of the numerator and denominator without actually expanding the product, to determine the end behavior of the function.
How can you tell if a rational function has an oblique asymptote?
-A rational function has an oblique asymptote if the degree of the polynomial in the numerator is exactly one more than the degree of the polynomial in the denominator.
What is the role of the number line in graphing rational functions?
-The number line helps to organize the x-intercepts and vertical asymptotes, providing a visual guide for the placement of these features on the graph.
Outlines
📈 Introduction to Graphing Rational Functions
The video begins with an introduction to graphing rational functions, emphasizing the importance of understanding the steps involved in the process. The speaker outlines the intention to cover various aspects of graphing, including finding holes, vertical and horizontal asymptotes, and intercepts. The goal is to provide a clear, efficient method for graphing these functions with accuracy and speed.
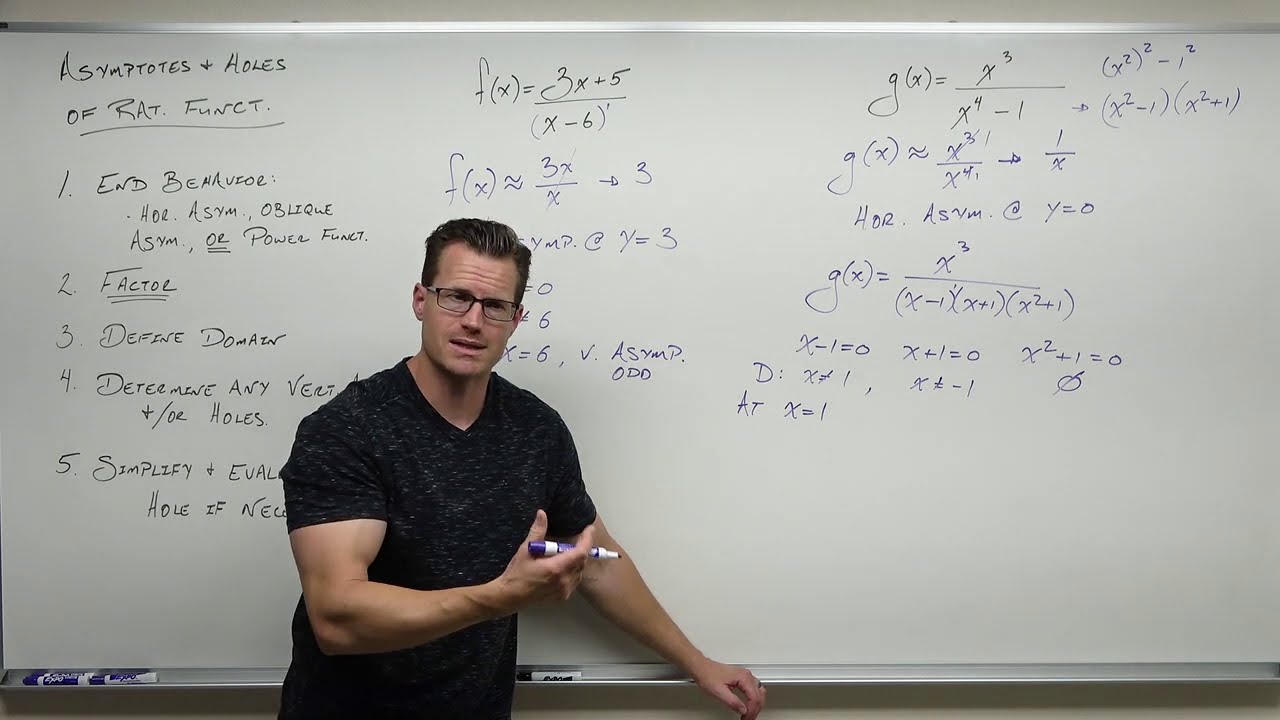
🔍 Identifying Asymptotes and Behaviors
The speaker explains the first step in graphing rational functions, which is to identify horizontal or oblique asymptotes and the end behavior of the function. This involves looking at the leading terms of the numerator and denominator to determine the function's long-term behavior as x approaches infinity or negative infinity.
🚫 Avoiding Common Pitfalls in Graphing
The video script highlights the importance of performing graphing steps in a specific order to avoid common pitfalls, such as finding x-intercepts before locating holes, which can lead to confusion. The speaker stresses the need to factor the polynomial, find vertical asymptotes, and understand their multiplicity to accurately graph the function.
🔢 Finding X and Y Intercepts
The process of finding x-intercepts and y-intercepts is detailed, with the speaker noting that x-intercepts are found by setting the numerator to zero and y-intercepts by plugging in zero for x. Special cases, such as horizontal asymptotes that are not zero, require additional steps to check for intersections.
📊 Constructing the Graph with Additional Points
The speaker describes how to create a number line with all relevant points marked, including x-intercepts and vertical asymptotes. By evaluating additional points within each interval, a more precise graph can be constructed, moving from a simple sketch to a detailed graph.
🤔 Understanding the Concept of Sketching vs. Graphing
The difference between sketching and graphing is discussed, with the speaker noting that while the process is still a form of sketching, it is a more detailed and accurate representation of the function. The importance of evaluating points and understanding the function's behavior in relation to asymptotes and intercepts is emphasized.
🔁 Dealing with Special Cases in Graphing
The video script addresses special cases in graphing rational functions, such as when there is no horizontal asymptote or when an oblique asymptote is present. The speaker provides guidance on how to handle these scenarios and what to consider when graphing functions that exhibit such behaviors.
🧩 Putting the Pieces Together
The speaker concludes by summarizing the steps for graphing rational functions, encouraging viewers to trust the process and the concepts they have learned. The goal is to see how the individual components of the function, such as end behavior, asymptotes, and intercepts, come together to form a coherent graph.
📚 Final Thoughts on Graphing Rational Functions
The video ends with a reminder of the complexity of graphing rational functions and the satisfaction of successfully plotting them. The speaker expresses hope that the steps and methods explained will help viewers understand and apply the process to a variety of rational functions.
Mindmap
Keywords
💡Rational Functions
💡Horizontal Asymptote
💡Vertical Asymptote
💡X-Intercepts
💡Y-Intercept
💡Oblique Asymptote
💡End Behavior
💡Hole
💡Factoring
💡Multiplicity
💡Long Division of Polynomials
Highlights
The video introduces a comprehensive guide on graphing rational functions, combining all previously learned concepts.
Six examples are presented, ranging from straightforward to more complex scenarios, including special cases.
The importance of identifying horizontal asymptotes, oblique asymptotes, and end behavior is emphasized for initial graph setup.
The method for finding vertical asymptotes and determining their multiplicity (odd or even) is explained.
The concept of holes in rational functions and how to identify their location on the graph is discussed.
X-intercepts and Y-intercepts are calculated, with attention to whether they are crosses or bounces off the axes.
Special cases where the horizontal asymptote is not zero are explored, including how to find intersections with the function.
The video demonstrates how to handle functions with no horizontal asymptote and their corresponding end behavior.
The process of creating a number line with relevant points such as x-intercepts and vertical asymptotes is shown.
Extra points are evaluated for each interval to enhance the precision of the graph.
The distinction between sketching and graphing is clarified, with the latter involving more accurate plotting of points.
A step-by-step approach to graphing rational functions is provided, from end behavior to the final plot.
The video addresses how to deal with even and odd multiplicities in vertical asymptotes and their impact on the graph.
Techniques for graphing functions with holes, ensuring the graph passes through the hole without an x-intercept.
The use of long division to find oblique asymptotes and their intersections with the rational function is demonstrated.
The video concludes with special cases, such as functions with no x-intercepts and identifying the function from a given graph.
A systematic approach to graphing is emphasized, ensuring that all components of the function, such as asymptotes and intercepts, are accurately represented.
Transcripts
Browse More Related Video
How to graph a rational function using 6 steps
Horizontal and Vertical Asymptotes - Slant / Oblique - Holes - Rational Function - Domain & Range
Finding Vertical Asymptotes of Rational Functions (Precalculus - College Algebra 38)
Graphing Rational Functions With Vertical, Horizontal & Slant Asymptotes, Holes, Domain & Range
Finding Asymptotes and Holes of Rational Functions (Precalculus - College Algebra 43)
How To Find The Vertical Asymptote of a Function
5.0 / 5 (0 votes)
Thanks for rating: