Introduction to Statistics (1.1)
TLDRThe video script introduces the fundamental concepts of statistics, highlighting its role in collecting and interpreting data to analyze variability. It distinguishes between inferential and descriptive statistics, explaining their applications in making judgments about populations and summarizing data, respectively. The script further delves into basic definitions such as population, sample, sample size, and variables, and differentiates between categorical and quantitative data, including the subcategories of ordinal, nominal, discrete, and continuous variables. This comprehensive overview serves as a foundation for understanding statistical analysis.
Takeaways
- 📊 Statistics involves the collection, analysis, and interpretation of data to understand variability among different individuals or groups.
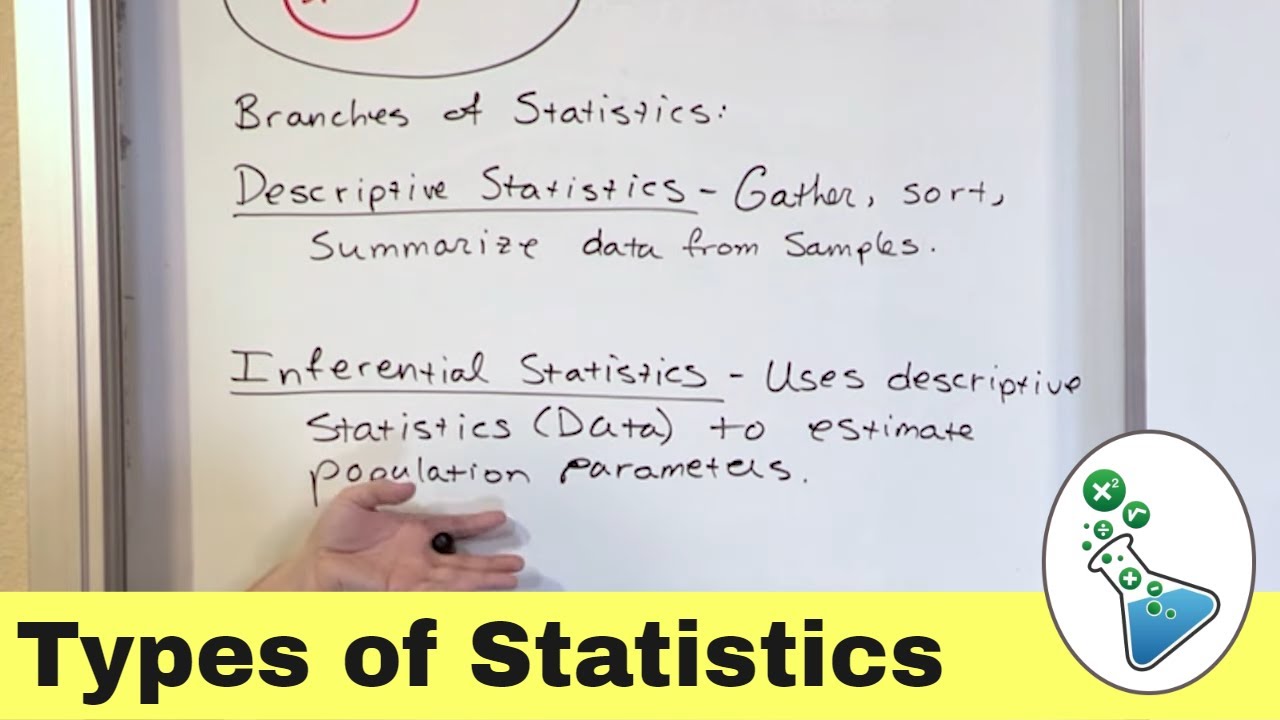
- 🔍 There are two main types of statistics: inferential and descriptive. Inferential statistics use sample data to make judgments about a population, while descriptive statistics summarize and describe data.
- 📈 Descriptive statistics are used to communicate findings such as average scores, often aided by histograms and graphs.
- 📝 A population is the entire group of items or individuals that are being studied, and a sample is a smaller subset of this population.
- 🔢 Sample size refers to the total number of individuals or items within the sample being studied.
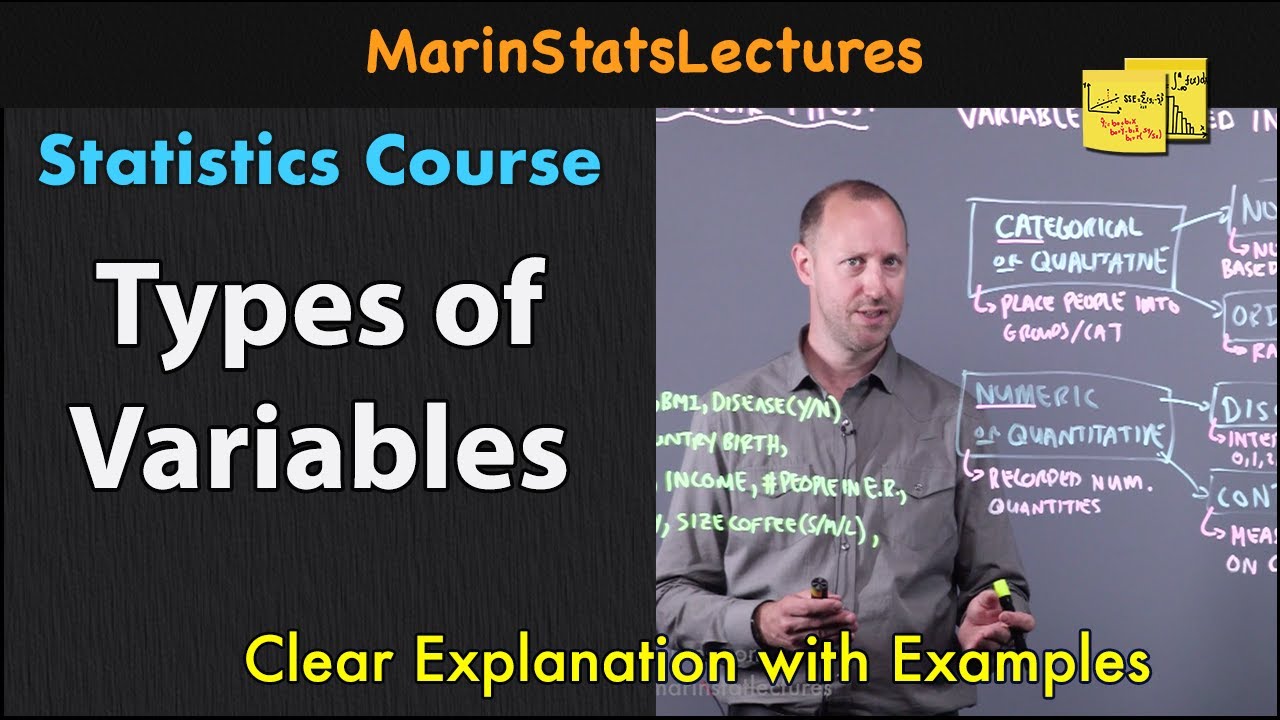
- 🔄 A variable is a characteristic that can be measured and varies among individuals within a population.
- 📊 Data can be categorized as either categorical or quantitative. Categorical data divides items into groups or categories, while quantitative data is numerical and can be calculated.
- ➡️ Categorical data can be further divided into ordinal and nominal. Ordinal data has a logical order (e.g., letter grades), while nominal data does not (e.g., hair color).
- 🔢 Quantitative data can be discrete, like the number of pets one can own, or continuous, like weight which can have decimal values.
- 📋 The type of data (quantitative or categorical) is determined by how the variable of interest is measured and what kind of information is extracted.
- 🔍 Understanding these basic definitions is crucial for grasping the concepts of statistics and applying them in data analysis.
Q & A
What is the definition of statistics?
-Statistics is the science of collecting, analyzing, interpreting, and presenting data.
What are the two main types of statistics mentioned in the transcript?
-The two main types of statistics are inferential statistics and descriptive statistics.
What does inferential statistics involve?
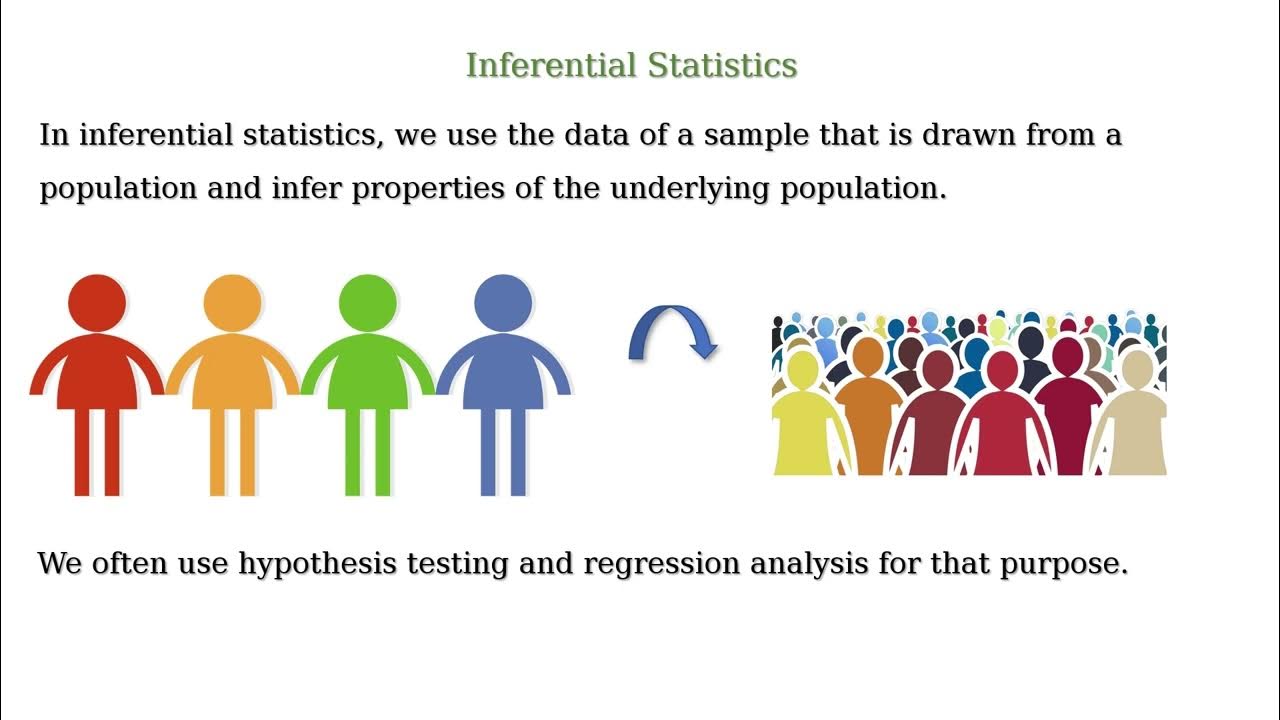
- Inferential statistics involves taking a sample from a population, analyzing that sample, and then making judgments or claims about the entire population.
How is descriptive statistics different from inferential statistics?
-Descriptive statistics refers to the process of collecting data and summarizing it using various statistical tools like histograms and graphs, whereas inferential statistics uses sample data to make inferences about a population.
What is a population in the context of statistics?
-A population in statistics refers to the entire set of items, people, or events that you want to study or analyze.
What is a sample in statistics?
-A sample is a smaller subset of a population that is taken for the purpose of study, and the number of items in a sample is known as the sample size.
What does a variable represent in statistics?
-In statistics, a variable represents a characteristic or attribute that can vary among individuals within a population or sample, such as height, weight, or hair color.
What are the two forms of data measurement in statistics?
-The two forms of data measurement in statistics are categorical data and quantitative data.
How is quantitative data different from categorical data?
-Quantitative data is numerical and can involve arithmetic calculations like averages,而来自主群体或样本的个体之间的差异,例如身高、体重或发色。
What is an example of a categorical variable?
-An example of a categorical variable is hair color, which places individuals into different groups based on color without a logical order.
What is the difference between discrete and continuous quantitative variables?
-Discrete variables can only be measured in certain distinct numbers, like the number of pets one owns, while continuous variables can take on any numerical value, such as a person's weight.
Outlines
📊 Introduction to Statistics
This paragraph introduces the fundamental concept of statistics, which involves the collection and interpretation of data from various aspects of life. It explains the significance of understanding variability, such as differences in height, weight, hair color, and food preferences among individuals. The paragraph distinguishes between two types of statistics: inferential and descriptive. Inferential statistics is about making judgments or claims about a population based on a sample, while descriptive statistics involve summarizing and explaining data, often using visual aids like histograms and graphs. The paragraph sets the stage for the course structure, with the first part focusing on descriptive statistics and the second on inferential statistics.
Mindmap
Keywords
💡Statistics
💡Data
💡Inferential Statistics
💡Descriptive Statistics
💡Population
💡Sample
💡Variable
💡Categorical Data
💡Quantitative Data
💡Histograms and Graphs
💡Arithmetic Calculations
Highlights
Statistics is the collection and interpretation of data from around the world.
Statistics helps measure and analyze variability such as height, weight, hair color, and food preferences.
There are two kinds of statistics: inferential and descriptive.
Inferential statistics involves taking a sample and making judgments about a population.
Descriptive statistics refers to summarizing and explaining data through measures like average scores.
Histograms and graphs are tools used to aid in the summarization of descriptive statistics.
Understanding statistics requires knowledge of basic definitions like population and sample.
A population is the total amount of things being studied, such as people, cats, or vehicles.
A sample is a small part of the population used for study, with a known sample size.
Variables in statistics represent characteristics of what is being studied and can vary among individuals.
Data in statistics can be categorical or quantitative.
Quantitative data is measured in numbers and can involve arithmetic calculations like averages.
Categorical data places things into different groups or categories, like hair color or type of pet.
Categorical variables can be either ordinal or nominal, with ordinal having a logical order and nominal not.
Quantitative variables can be discrete, like the number of pets, or continuous, like weight.
Descriptive statistics involve measuring variables directly, such as individual test scores.
Categorical data in statistics involves categorizing individuals based on variables like letter grades.
Transcripts
Browse More Related Video

Basic Terms of Statistics/ Population/Sample/Parameter/Variable/ urdu and hindi
Variables and Types of Variables | Statistics Tutorial | MarinStatsLectures
What is Descriptive Vs. Inferential Statistics?
Descriptive vs Inferential Statistics

Descriptive Statistics: FULL Tutorial - Mean, Median, Mode, Variance & SD (With Examples)
Descriptive Statistics vs. Inferential Statistics
5.0 / 5 (0 votes)
Thanks for rating: