Graphical Differentiation
TLDRThe video script is an educational lesson on graphical differentiation, a method for finding the derivative of a function when only a graph is available, not an equation. The instructor emphasizes that while this technique won't be a main focus of the course, understanding the basics is crucial. The process involves analyzing the slope of the graph at various points to determine the derivative. Key points include recognizing that at sharp corners or discontinuities, the derivative is undefined due to the non-existence of the limit. The instructor also explains that the derivative graph will show a positive slope where the original function is increasing and a negative slope where it's decreasing. Furthermore, a constant slope in the original function results in a flat derivative graph, and turning points in the function correspond to the derivative touching the x-axis. The script uses several examples to illustrate these concepts, providing a clear understanding of how to apply graphical differentiation.
Takeaways
- 📈 **Graphical Differentiation**: The process of finding a derivative by analyzing the slope of a graph when the function's equation is not available.
- 🔍 **Slope Analysis**: To perform graphical differentiation, one must focus on the slope at each point on the graph, as the derivative represents the instantaneous rate of change.
- 📌 **Sharp Corners & Discontinuities**: At points where the graph has a sharp corner or discontinuity, the derivative does not exist, and the slope is undefined.
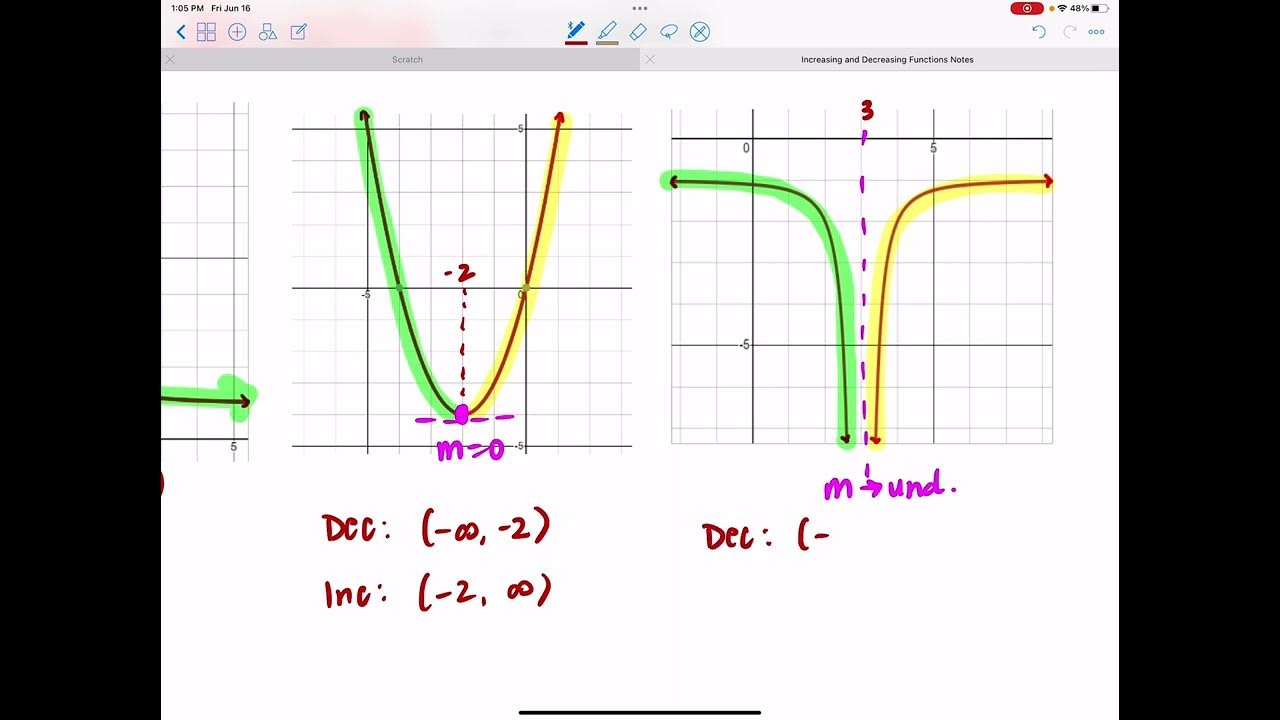
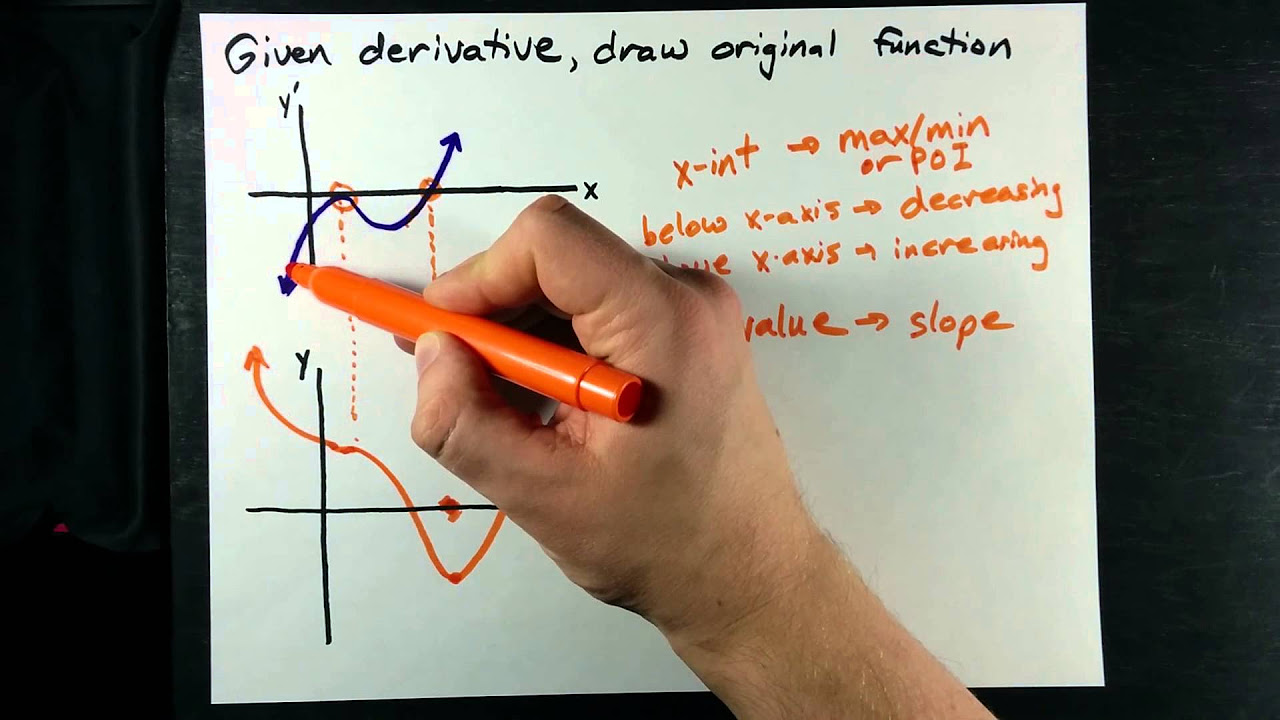
- 🔺 **Increasing vs. Decreasing**: An increasing interval on the graph (rising from left to right) corresponds to a positive slope for the derivative, while a decreasing interval corresponds to a negative slope.
- ↗️ **Positive and Negative Slopes**: Positive slopes indicate the graph is above the x-axis, and negative slopes indicate it is below the x-axis.
- 🔄 **Linear Functions**: If the original function is linear (constant slope), the derivative will be a constant value (flat line).
- 🔃 **Turning Points**: At turning points where the graph changes direction, the slope of the tangent is zero, and the derivative touches the x-axis.
- 📉 **Quadratic Functions**: The derivative of a quadratic function (highest degree of x is 2) is always a linear function.
- 🔀 **Symmetry**: The behavior of the derivative graph can sometimes be inferred by symmetry from the original function's graph.
- 🚫 **Undefined Slopes**: A vertical tangent or any feature that would make the limit not exist results in an undefined slope for the derivative, creating a hole or asymptote in the derivative graph.
- ➿ **X-Intercepts**: The derivative function will have x-intercepts where the original function's slope is zero or at turning points.
Q & A
What is graphical differentiation?
-Graphical differentiation is the process of finding the derivative of a function based on its graph, particularly when an algebraic equation for the function is not available.
Why is it necessary to analyze the slope of a graph in graphical differentiation?
-The slope of a graph at any point represents the instantaneous rate of change at that point, which is the definition of the derivative. Therefore, analyzing the slope is crucial to determine the derivative graphically.
What happens to the derivative function at a sharp corner on the graph?
-At a sharp corner, the limit does not exist, which means the derivative is not defined at that point. This results in a hole or discontinuity in the derivative function.
How does the slope of a graph relate to whether the derivative is positive or negative?
-If the graph is increasing (rising from left to right), the slope is positive, and if the graph is decreasing, the slope is negative. This means the derivative will be above the x-axis for increasing functions and below the x-axis for decreasing functions.
What is the relationship between a discontinuity in a function and its differentiability?
-A discontinuity in a function means that the limit does not exist at that point, which implies the function is not differentiable there. Hence, the derivative will be undefined at points of discontinuity.
How can you approximate the slope of a graph at a given point for graphical differentiation?
-You can approximate the slope by drawing a tangent line at the point of interest and then determining the rise over run (change in y over change in x) to estimate the slope.
What is the derivative of a quadratic function?
-The derivative of a quadratic function, which is a function of the form f(x) = ax^2 + bx + c, is a linear function, specifically f'(x) = 2ax + b.
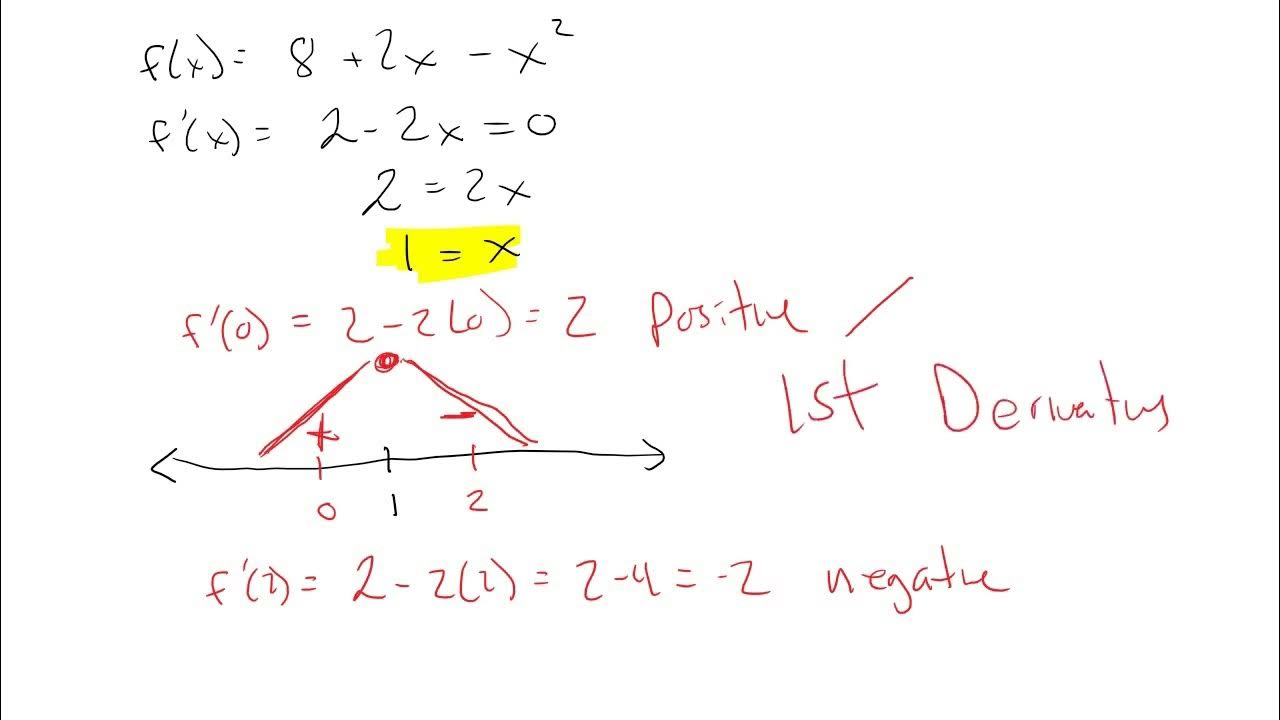
How does the presence of a turning point in a graph affect the derivative?
-At a turning point, the slope of the original function is zero because the tangent line is horizontal. Consequently, the derivative function touches the x-axis at these points.
Why does the derivative of a linear function result in a constant or flat function?
-A linear function has a constant slope, which means that the rate of change is the same throughout. Therefore, its derivative, representing the rate of change, is constant or flat.
How can you determine which graph is the original function and which is the derivative if both are given?
-You can determine this by looking for characteristics such as turning points (where the derivative touches the x-axis), constant slopes (indicating a linear derivative), and the overall shape of the graphs (a parabola for the original function usually means a linear graph for the derivative).
What is the significance of the derivative being positive or negative in relation to the original function?
-A positive derivative indicates that the original function is increasing (rising from left to right), while a negative derivative indicates that the original function is decreasing. This relationship helps in understanding the behavior of the function.
Outlines
📈 Introduction to Graphical Differentiation
The first paragraph introduces the concept of graphical differentiation, which involves finding the derivative of a function based on its graph when an equation is not available. It emphasizes the importance of analyzing the slope of the graph at various points to determine the derivative. The instructor cautions that this is a visual concept that might be tricky to grasp but assures that understanding the basics is sufficient for the course.
🔍 Analyzing Slope for Derivatives
This paragraph delves into the process of graphical differentiation by examining the slope of a given graph. It discusses how to identify the slope for different intervals of the graph and how to represent these slopes in a table. The paragraph also clarifies the difference between an increasing graph (positive slope) and a positive graph (above the x-axis), and how these affect the derivative.
⚠️ Handling Sharp Corners and Discontinuities
The third paragraph addresses the challenges of differentiating functions at sharp corners and points of discontinuity, where the slope is undefined. It explains that these points will result in holes or asymptotes in the derivative function. The paragraph also covers how to approximate slopes in areas where the graph is not constant and the importance of recognizing when a graph is increasing or decreasing.
📉 Sketching the Derivative Graph
This section illustrates how to sketch the graph of the derivative based on the behavior of the original function. It discusses how to handle linear sections, undefined slopes at sharp corners, and how the slope of the derivative changes as the original function increases or decreases. The paragraph concludes with a sketch of the derivative graph, reflecting the various behaviors observed in the original function.
🔄 Identifying Function Behaviors
The fifth paragraph focuses on identifying different behaviors of the original function and how they translate to the derivative. It explains that a linear function results in a constant derivative, a discontinuous function leads to undefined derivatives at those points, and the relationship between the increasing/decreasing nature of the function and the sign of the derivative.
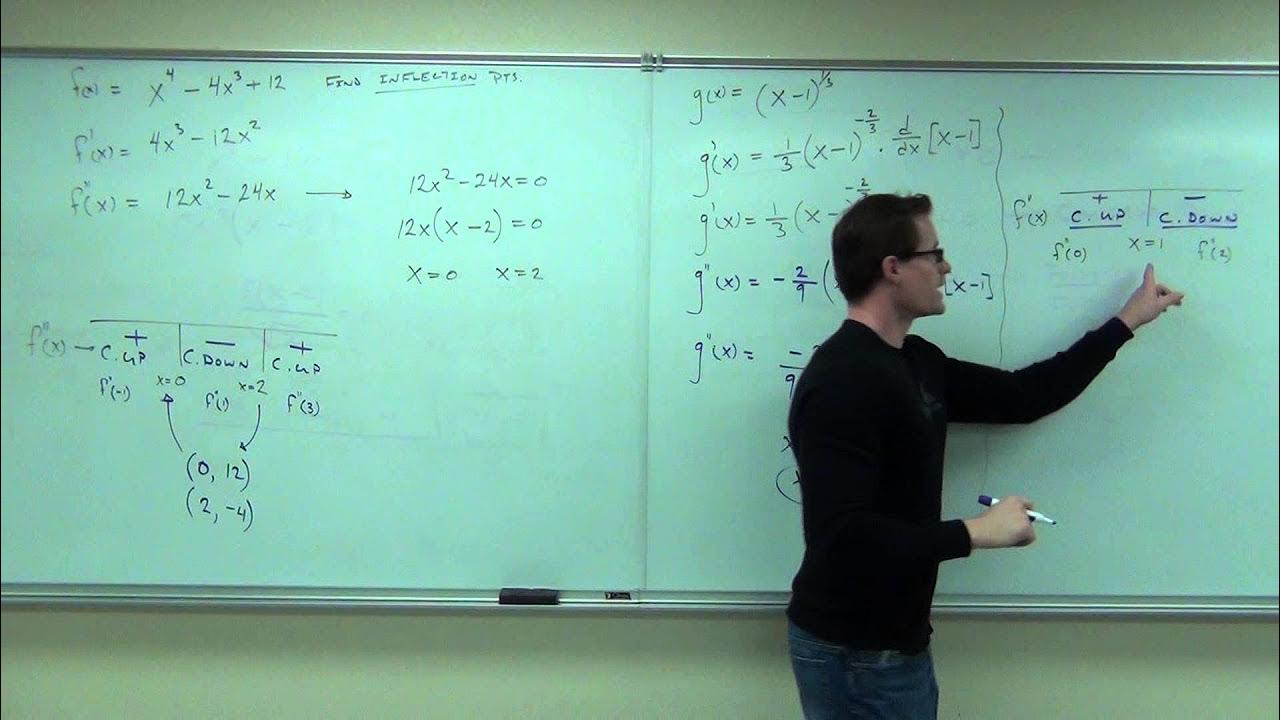
🧮 Derivative Characteristics of Quadratic Functions
The sixth paragraph highlights the characteristics of the derivative of a quadratic function, noting that it will always be a linear function. It discusses how to identify turning points in the original function and how these correspond to points where the derivative touches the x-axis. The paragraph also emphasizes the correspondence between the increasing/decreasing nature of the original function and the sign of the derivative.
📚 Summary and Final Thoughts
The final paragraph summarizes the key takeaways from the lesson, reminding students that they will not be required to draw derivative graphs for their assignments. It reassures students to do their best and offers help for further clarification if needed.
Mindmap
Keywords
💡Graphical Differentiation
💡Derivative
💡Slope
💡Instantaneous Rate of Change
💡Sharp Corner
💡Discontinuity
💡Increasing Function
💡Decreasing Function
💡Turning Point
💡Quadratic Function
💡Linear Function
Highlights
Graphical differentiation involves finding a derivative based on a graph, especially when a function's equation is not available.
The process requires analyzing the slopes of the graph to determine the instantaneous rate of change at any point along the curve.
At sharp corners or discontinuities, the derivative is undefined because the limit does not exist.
An increasing function (positive slope) corresponds to a positive derivative (above the x-axis), while a decreasing function (negative slope) corresponds to a negative derivative (below the x-axis).
If a function is linear with a constant slope, its derivative will be a constant value.
The presence of a turning point in a graph, where the function changes from increasing to decreasing (or vice versa), results in a horizontal tangent line and a derivative of zero.
The derivative of a quadratic function (highest degree of x is 2) is always a linear function.
Graphical differentiation is a visual concept that may be intuitive for some and challenging for others, but it is not a primary focus in the course.
When approximating slopes at various points on a graph, one can sketch tangent lines to estimate the rate of change.
The derivative function will have holes or asymptotes at points where the original function is not differentiable.
A constant function (horizontal line) will have a derivative that is a horizontal line intersecting the x-axis.
The process of graphical differentiation helps reinforce the concept of derivatives as rates of change, even without an explicit function equation.
For portions of a graph where the function is increasing at different rates, the derivative's slope will vary, approaching zero as the graph flattens out.
Graphical differentiation is a technique applicable when an equation is not available, relying solely on the graph's visual representation.
The derivative graph will show a constant slope (flat) where the original function's graph is linear, indicating a constant rate of change.
When a graph has a vertical tangent or a sharp corner, the derivative at that point is undefined, resulting in a discontinuity in the derivative function.
The concept of graphical differentiation is useful for understanding the behavior of functions and their derivatives, even when an algebraic expression is not present.
Transcripts
Browse More Related Video

5.0 / 5 (0 votes)
Thanks for rating: