Introduction To Ordinary Least Squares With Examples
TLDRThe video script introduces the concept of the Ordinary Least Squares (OLS) method, a widely used technique in linear regression analysis. It explains how to determine the best-fit line through data points by minimizing the sum of the squares of the residuals, which are the differences between the actual and predicted values. The OLS method ensures that the chosen regression line best represents the data, offering a clear and optimal model for understanding relationships within the data set.
Takeaways
- 📊 The script introduces the concept of finding the 'best' linear regression line among multiple possible lines fitting a set of data points.
- 🔍 The 'best' line is determined by minimizing the sum of the squares of the residuals, a method known as the Ordinary Least Squares (OLS) method.
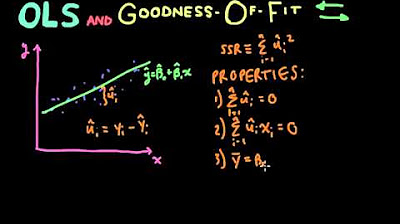
- 🌟 The OLS method projects data points vertically onto the regression line and calculates the difference (residual) between the actual and predicted values.
- 🥔 The example used in the script involves predicting potato yields based on the amount of nitrogen fertilizer used, with the actual yield (y_i) and the predicted yield (y_i_hat).
- 📉 The residual is the difference between the actual and predicted values, and minimizing these residuals leads to the 'best fit' line.
- 🏆 The goal of the OLS method is to find the line that has the smallest sum of squared residuals, indicating the best fit through the data points.
- 🔢 The process involves squaring each residual for every data point and then summing these values to find the minimum.
- 🧠 Understanding the OLS method is fundamental for modeling problems in machine learning and statistics.
- 📈 The best linear regression line is not expected to pass perfectly through every data point, but should minimize the overall deviation.
- 🎯 The parameters B0 and B1 in the regression equation are determined to minimize the sum of squared residuals.
- 📝 The script concludes by emphasizing the importance of the OLS method in machine learning and its role in finding the optimal regression line for a given dataset.
Q & A
What is the main question the tutorial aims to answer?
-The tutorial aims to answer how to determine the best sloped line (the best linear regression) among multiple possible lines that can be drawn through a set of data points.
What is the ordinary least squares method?
-The ordinary least squares method is a technique used for fitting a linear regression line to a set of data points by minimizing the sum of the squares of the residuals (differences between the actual and predicted values).
What are residuals in the context of the script?
-Residuals are the differences between the actual values (y_i) and the predicted values (y_i hat) for each data point in a linear regression analysis.
How does the ordinary least squares method visually select the best line?
-The ordinary least squares method visually selects the best line by projecting the data points vertically onto the regression line and minimizing the sum of the squares of the residuals for all data points.
Why is it impossible for a line to go perfectly through every single data point?
-It is impossible because there will always be some degree of variation in the data, and a single linear regression line cannot account for every nuance and outlier in the dataset.
What is the goal when finding the best linear regression line?
-The goal is to find a line that has the smallest sum of the squares of residuals, indicating the best fit to the data points while minimizing the differences between the actual and predicted values.
What happens when you square the residuals?
-Squaring the residuals helps to eliminate the effect of negative and positive differences, allowing for a straightforward comparison of the magnitude of the residuals without being influenced by their direction.
How does the tutorial illustrate the concept of actual and predicted values?
-The tutorial uses an example of potato yield from a farm with a specific amount of nitrogen fertilizer used. The actual value is the real yield (e.g., two tons of potatoes), while the predicted value is what the linear regression model estimates the yield to be (e.g., one and a half tons of potatoes).
What is the significance of minimizing the sum of the squares of the residuals?
-Minimizing the sum of the squares of the residuals ensures that the chosen linear regression line is the one that has the least amount of overall deviation from the actual data points, leading to a better model fit.
What does the best linear regression line guarantee?
-The best linear regression line guarantees that the model will closely follow the data points, providing a good fit for the given dataset and allowing for better predictions and modeling of the problem at hand.
How does the tutorial conclude?
-The tutorial concludes by summarizing the ordinary least squares method and expressing anticipation for the next tutorial, where further insights into machine learning will be explored.
Outlines
📊 Introduction to Ordinary Least Squares
This paragraph introduces the concept of Ordinary Least Squares (OLS) as a method for determining the best-fit line for a set of data points. It explains that while there can be multiple potential lines of best fit, the goal is to find the line that minimizes the differences (residuals) between the actual data points and the predicted values by the line. The OLS method is described as projecting data points onto a linear regression line and minimizing the sum of the squares of these residuals to find the optimal line for modeling the data.
Mindmap
Keywords
💡Ordinary Least Squares
💡Linear Regression
💡Data Points
💡Residual
💡Best Fit Line
💡Slope
💡Predictive Modeling
💡Nitrogen Fertilizer
💡Yield
💡Sum of Squares
💡Machine Learning
Highlights
Introduction to the concept of best linear regression lines.
Explaining the process of drawing multiple slope lines through data points.
Defining the best linear regression line through the ordinary least squares method.
Visual explanation of projecting data points onto a linear regression line.
Description of actual values (y_i) and their importance in the context of potato yield.
Explanation of predicted values (y_i_hat) in linear regression.
Introduction and definition of residuals in a linear regression model.
The role of residuals in determining the best fitting linear regression line.
Minimization of the sum of squares of residuals as the criterion for the best line.
Process of squaring each residual and summing them up.
The goal of finding the line where the sum of squared residuals is the smallest.
Guaranteeing that the best line fits nicely through the data points.
The ordinary least squares method as a tool for modeling problems effectively.
Anticipating the next tutorial for further understanding of machine learning concepts.
The importance of the ordinary least squares method in the field of machine learning.
Transcripts
Browse More Related Video

10.2.5 Regression - Residuals and the Least-Squares Property

Correlation and Regression (6 of 9: Sum of Squares - SSE, SSR and SST)

Econometrics // Lecture 3: OLS and Goodness-Of-Fit (R-Squared)

The Main Ideas of Fitting a Line to Data (The Main Ideas of Least Squares and Linear Regression.)

Ordinary Least Squares Regression

Introduction to residuals and least squares regression
5.0 / 5 (0 votes)
Thanks for rating: