GCSE Physics - Distance-Time Graphs #53
TLDRThis video script explains the concept of distance-time graphs, illustrating how they depict an object's movement over time. It emphasizes that the gradient of the graph represents speed, with straight lines indicating constant speed, flat lines signifying no movement, and curves showing variable speed. To find the speed at a specific time on a curve, a tangent is used to determine the gradient at that point. The explanation is designed to enhance understanding of how to interpret and use distance-time graphs to analyze motion.
Takeaways
- 📊 Distance-time graphs visualize an object's movement over time, such as a cyclist's journey.
- 🏃♀️ The total distance and time are represented, like 50 meters in 11 seconds.
- 📈 The gradient of the line on the graph indicates the speed of the object at any given time (gradient = change in distance / change in time).
- 🚴 Speed is constant when the line is straight, meaning the object travels at a uniform pace.
- 🛑 A flat line signifies the object is stationary (zero speed).
- 🔼 An increasing gradient signifies acceleration, while a decreasing gradient indicates deceleration.
- 📐 To find speed at a specific point on a curve, draw a tangent to the curve at that point.
- 🤔 The speed at a point on a curve is calculated by finding the gradient of the tangent line at that point.
- 🔢 For a straight line, calculate the gradient by dividing the change in distance by the change in time.
- 🎥 Understanding these concepts helps in interpreting the different stages of a journey on a distance-time graph.
Q & A
What does a distance-time graph represent?
-A distance-time graph represents the distance an object has traveled over a certain period of time. It provides a visual representation of the journey, allowing us to understand the different stages of motion, including constant speed, stationary, acceleration, and deceleration.
How can you determine the total distance traveled by an object using a distance-time graph?
-You can determine the total distance traveled by reading the vertical axis at a given time. For example, if a cyclist is represented on the graph and the total time of the journey is 11 seconds, you would read the distance on the vertical axis at the 11-second mark to find out the total distance traveled.
What does the gradient of a line on a distance-time graph indicate?
-The gradient of a line on a distance-time graph indicates the speed of the object at that particular time. The gradient is calculated as the change in distance divided by the change in time, which is the formula for speed. A steeper gradient means a higher speed, while a flat gradient indicates the object is stationary.
How can you interpret a straight line section on a distance-time graph?
-A straight line section on a distance-time graph indicates that the object is moving at a constant speed. The gradient of the line represents the average speed during that section of the journey. For instance, if the line shows 20 meters traveled in 2 seconds, the gradient and thus the speed is 10 meters per second.
What does a flat line on a distance-time graph signify?
-A flat line on a distance-time graph signifies that the object is stationary. This means there is no change in distance from the starting point over the period of time represented by that flat section of the graph, indicating that the speed is zero.
How can you identify acceleration or deceleration on a distance-time graph?
-Acceleration or deceleration on a distance-time graph can be identified by changes in the gradient of the line. An increasing gradient indicates acceleration, where the speed of the object is increasing. Conversely, a decreasing gradient indicates deceleration, where the speed is decreasing.
If a speed needs to be calculated at a specific point on a curved line of a distance-time graph, what should be done?
-To calculate the speed at a specific point on a curved line, you should draw a tangent to the curve at that point. The gradient of the tangent line at the point of interest represents the speed at that exact moment. The gradient is found by selecting two points along the tangent line and dividing the change in distance by the change in time between those points.
What is the relationship between the distance-time graph and the formula for speed?
-The relationship between the distance-time graph and the formula for speed is directly represented through the gradient of the line. The formula for speed is the distance traveled divided by the time taken, which is the same as the gradient of the line on the graph. Hence, the graph visually shows the speed of the object at different points in time.
How can you calculate the speed during a curved section of a distance-time graph?
-To calculate the speed during a curved section, you first draw a tangent line to the curve at the specific point where the speed is to be determined. Then, you calculate the gradient of this tangent line by finding the change in distance and dividing it by the change in time between two points along the tangent. This calculated gradient gives you the speed at the precise point in time.
What is the significance of the gradient being equal to the speed on a distance-time graph?
-The significance of the gradient being equal to the speed on a distance-time graph is that it provides a visual and mathematical representation of how fast an object is moving at any given moment. This direct relationship allows for easy interpretation of the graph and the ability to quickly understand and calculate the speed of an object during its journey.
What are the different parts of a journey represented on a distance-time graph?
-The different parts of a journey represented on a distance-time graph include constant speed travel, periods of being stationary, and periods of acceleration or deceleration. Each section is represented by different line segments or curves, with straight lines indicating constant speed and curves indicating changing speed.
How can you determine if an object is moving in the same direction throughout its journey on a distance-time graph?
-If an object is moving in the same direction throughout its journey, the line on the distance-time graph will not have any negative gradients or downward slopes. A positive gradient indicates continuous motion in the same direction, while a negative gradient would indicate the object is moving in the opposite direction, such as returning to its starting point.
Outlines
📊 Understanding Distance-Time Graphs
This paragraph introduces the concept of distance-time graphs and their use in visualizing the journey of an object, such as a cyclist, over a certain period. It explains that the graph can represent the total distance traveled and the different stages of the journey. The key takeaway is understanding the gradient of the line on the graph, which indicates the speed of the object at any given time. The gradient is calculated as the change in distance divided by the change in time, reflecting the formula for speed. The paragraph emphasizes the importance of interpreting the gradient to understand constant speeds (straight lines), being stationary (flat lines), and changing speeds (curved lines).
Mindmap
Keywords
💡distance time graph
💡gradient
💡speed
💡constant speed
💡stationary
💡acceleration
💡deceleration
💡tangent
💡change in distance
💡change in time
💡curve
Highlights
Distance time graphs visualize the journey of an object over a period of time.
The total distance traveled and time taken can be read from the graph, such as 50 meters in 11 seconds.
Different parts of the journey can be interpreted from the graph to understand various stages.
The gradient of the line on a distance time graph represents the speed of the object at that particular time.
The formula for speed is the change in distance divided by the change in time, which equals the gradient.
A straight line on the graph indicates a constant speed.
A flat line signifies that the object is stationary, with a gradient and speed of zero.
An increasing gradient indicates acceleration, while a decreasing gradient signifies deceleration.
For a constantly changing speed, a tangent to the curve at a specific point is used to find the speed.
The gradient of the tangent at a point gives the speed at that exact moment.
To calculate the speed at a particular point, find two points along the tangent and use the change in distance divided by the change in time.
The video provides a comprehensive understanding of how to interpret distance time graphs.
The practical application of this knowledge can help in analyzing movements in various scenarios.
The method of using tangents for curved lines is a key technique in understanding the graph.
The video is engaging and informative, making complex concepts accessible to viewers.
The summary of the video content at the end reinforces the learning points.
Transcripts
Browse More Related Video
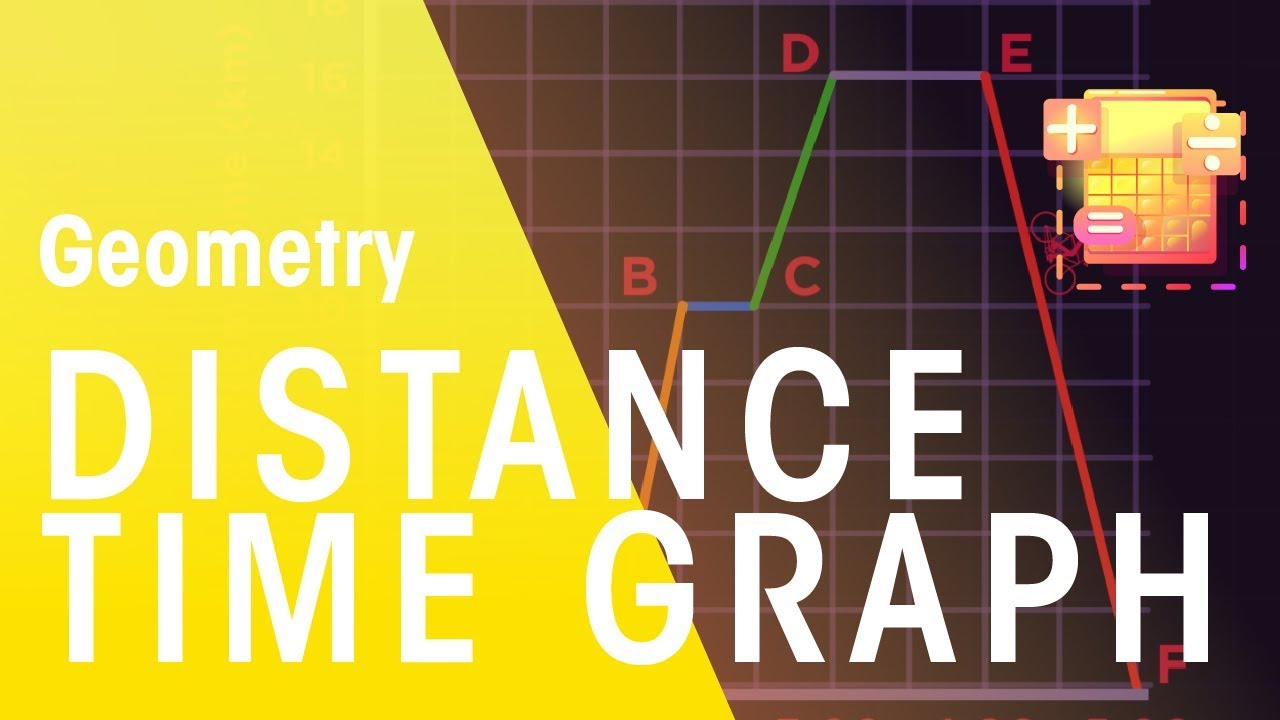
Distance Time Graphs | Geometry | Maths | FuseSchool
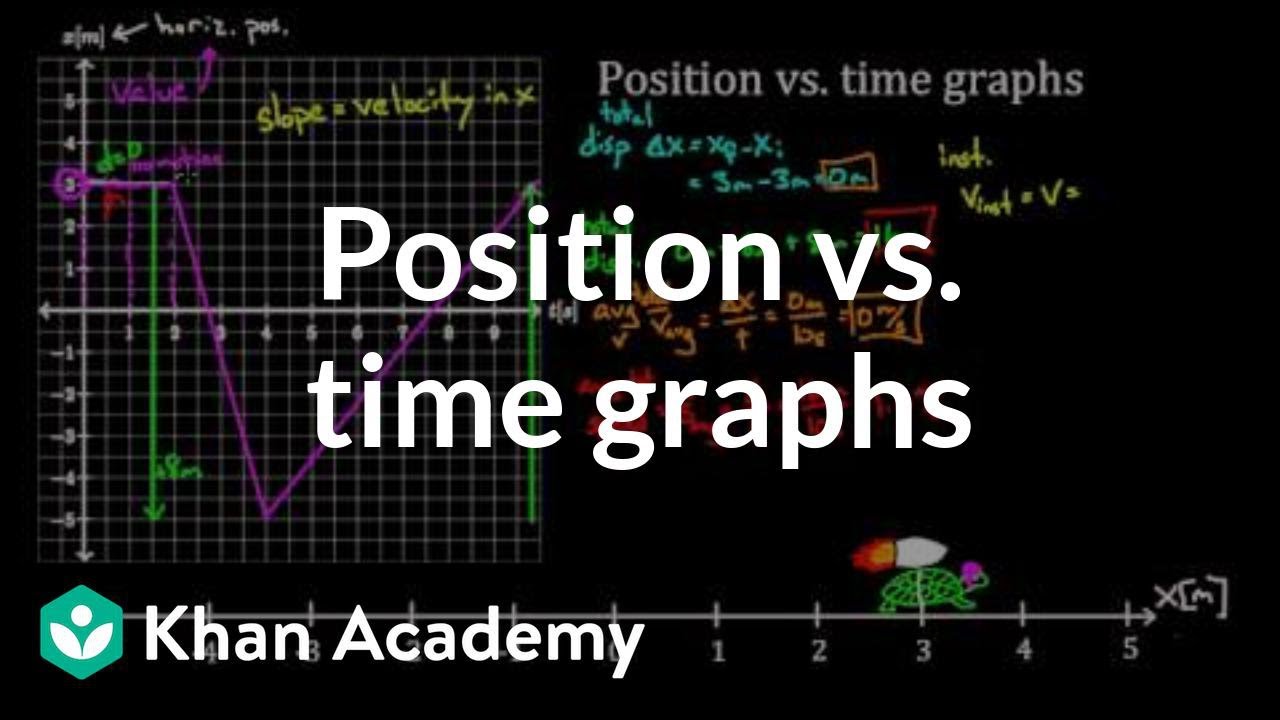
Position vs. time graphs | One-dimensional motion | Physics | Khan Academy
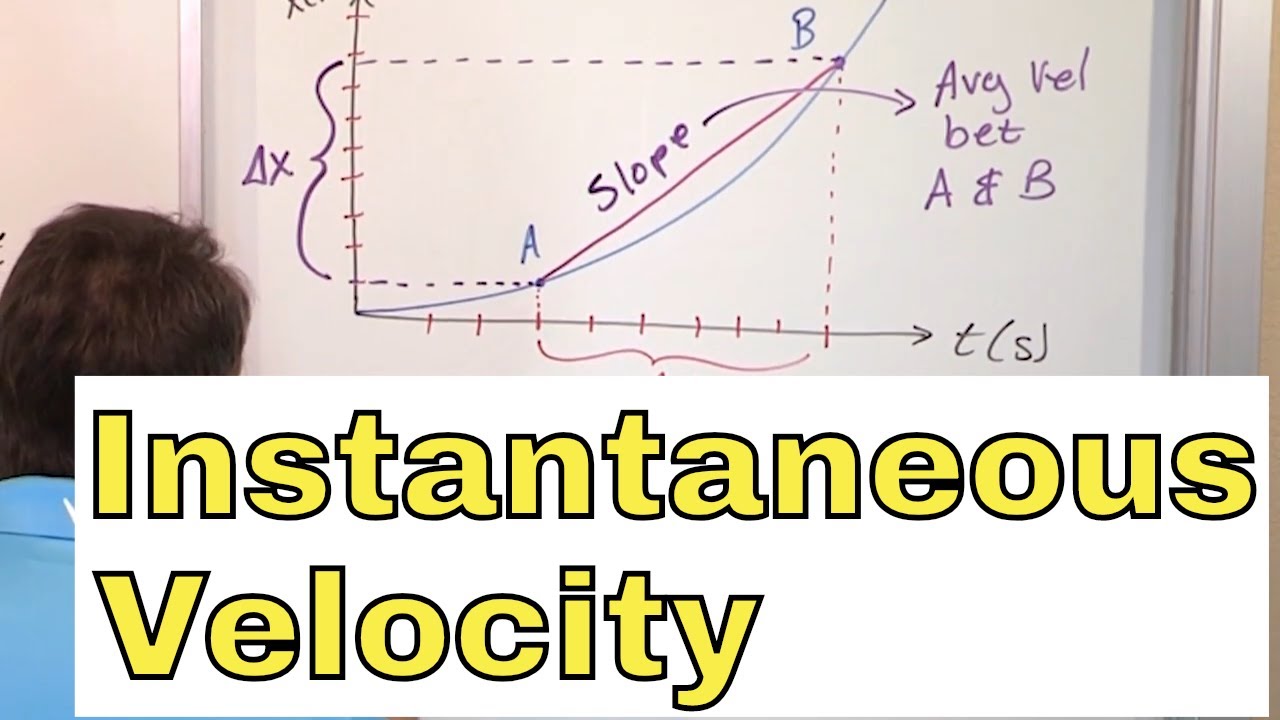
07 - What is Instantaneous Velocity?, Part 1 (Instantaneous Velocity Formula & Definition)
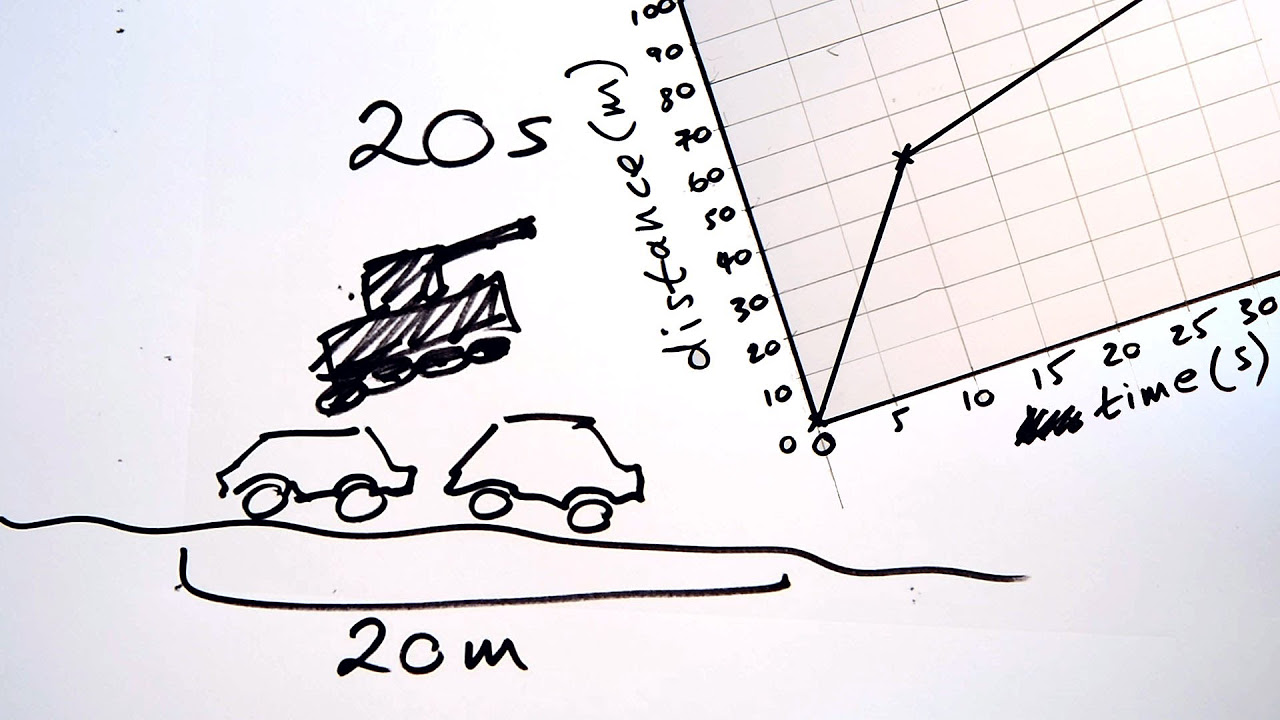
Distance-time graphs & speed - GCSE Science Shorts Sketch

GCSE Physics - Velocity Time Graphs #54
Interpreting Motion Graphs
5.0 / 5 (0 votes)
Thanks for rating: