Distance-time graphs & speed - GCSE Science Shorts Sketch
TLDRThis educational video script teaches the difference between distance-time and speed-time graphs, crucial for OCR GCSE Science, AQA P2, and Edexcel Topic 15. It uses the character Bob, who travels to YouTube HQ with varying speeds, to illustrate how to plot and interpret these graphs. The script guides viewers through plotting Bob's journey on a speed-time graph, calculating his speed at different intervals, and understanding the concept of gradient as average speed. It emphasizes the importance of concentration to avoid confusion and loss of marks in exams. The video also encourages viewers to learn more about speed-time graphs, acceleration, and to share their interests for future topics.
Takeaways
- 📚 The video is aimed at students preparing for OCR GCSE Science, AQA P2, and Edexcel Topic 15.
- 🔍 It addresses the common confusion between distance-time and speed-time graphs, emphasizing the importance of understanding the difference for exams.
- 👦 The video uses the character Bob and his journey to YouTube HQ as a practical example to illustrate the concepts.
- 🚶♂️ Bob's movement is broken down into three segments: covering the first 50 meters in 10 seconds, moving 20 meters in the next 20 seconds due to traffic, and the final 30 meters in 5 seconds.
- 📈 The video explains how to plot Bob's journey on a speed-time graph, starting from the origin and extending to 100 meters and 35 seconds.
- ⏱ Speed is defined as the rate of change of distance with respect to time, measured in meters per second (m/s).
- 📊 The gradient of a speed-time graph segment represents the average speed during that segment.
- 📐 The video demonstrates how to calculate Bob's speed at different points of his journey by finding the gradient of the graph segments.
- 🔢 For the first segment, Bob's speed is calculated as 5 m/s, for the second segment as 1 m/s, and for the final segment as 6 m/s.
- 🚫 A horizontal line on a distance-time graph indicates that there is no movement, as the distance is not increasing.
- 🔗 The video encourages viewers to learn more about speed-time graphs, acceleration, and related topics through provided links.
- 👍 The video ends with a call to action for likes and comments, asking viewers to suggest science topics for future sketches.
Q & A
What is the main topic covered in the video script?
-The main topic covered in the video script is the explanation of distance-time and speed-time graphs in the context of physics, specifically for OCR GCSE Science, AQA, and Edexcel exam boards.
Why are distance-time and speed-time graphs important for students preparing for exams?
-Distance-time and speed-time graphs are important for students as they help in understanding the concepts of speed and distance, which are crucial for solving physics problems. They can also help students avoid confusion and secure easy marks in exams.
What is the scenario described in the script involving Bob and his journey to YouTube HQ?
-The script describes a hypothetical scenario where Bob, carrying a tank, is traveling to YouTube HQ to offer his opinion on Google+. His journey is used as an example to illustrate how to plot and interpret distance-time and speed-time graphs.
How does Bob's journey illustrate the concept of a speed-time graph?
-Bob's journey is divided into three parts, each with different speeds. The script explains how to plot these parts on a speed-time graph, showing how speed changes over time, and how to calculate speed at different points using the gradient of the graph.
What is the formula used to calculate speed in the context of the script?
-The formula used to calculate speed in the script is speed equals distance divided by time, or speed = distance/time, which is also represented as m/s (meters per second).
How does the script define the gradient of a graph in the context of speed-time graphs?
-In the script, the gradient of a graph is defined as the vertical change (up) divided by the horizontal change (across), and it is used to calculate the speed or average speed during a particular segment of the journey.
What does a horizontal line on a distance-time graph indicate according to the script?
-A horizontal line on a distance-time graph indicates that the object is not moving during that period of time, as the distance is not increasing.
What is the speed of Bob during the first part of his journey as described in the script?
-During the first part of his journey, Bob travels 50 meters in 10 seconds, which means his speed is 5 m/s.
How does the script guide students to calculate Bob's speed during the second part of his journey?
-The script guides students to calculate Bob's speed during the second part of his journey by dividing the distance traveled (20 meters) by the time taken (20 seconds), resulting in a speed of 1 m/s.
What is the speed of Bob during the final stretch of his journey as mentioned in the script?
-During the final stretch of his journey, Bob travels 30 meters in 5 seconds, which means his speed is 6 m/s.
What additional topics are mentioned in the script for further learning?
-The script mentions that viewers can learn about speed-time graphs, acceleration, and where Bob escapes by clicking on a link provided in the description.
Outlines
📈 Understanding Speed-Time Graphs
This paragraph introduces the concept of speed-time graphs, which are essential for students preparing for OCR GCSE Science, AQA P2, and Edexcel Topic 15. It emphasizes the importance of differentiating between distance-time and speed-time graphs to avoid confusion and loss of marks in exams. The video script uses the character Bob and his journey to YouTube HQ to illustrate how to plot and interpret a speed-time graph. Bob's movements are broken down into three segments, with each segment's speed calculated by finding the gradient of the graph between two points, which represents the average speed during that time interval.
Mindmap
Keywords
💡Speed-Time Graphs
💡Distance-Time Graphs
💡Gradient
💡Speed
💡Acceleration
💡OCR
💡AQA
💡Edexcel
💡Bob
💡Google+
Highlights
Science Shorts explains speed, distance, and time graphs for OCR GCSC Science P3, AQA P2, and Edexcel Topic 15.
Confusion between distance-time and speed-time graphs can lead to lost marks in exams.
The video is split into two parts to avoid confusion between the two types of graphs.
Bob travels to YouTube HQ with a tank to discuss Google+.
Bob covers the first 50 meters in 10 seconds.
A speed-time graph is drawn starting at 0 m and 0 seconds, extending to 50 m and 10 seconds.
Bob encounters traffic and moves 20 meters in the next 20 seconds.
The graph is extended to 70 meters and 30 seconds to represent the traffic delay.
After traffic, Bob covers the final 30 meters in 5 seconds.
The final graph shows Bob's journey from 0 to 100 meters over 35 seconds.
Speed is calculated as distance divided by time (m/s).
The gradient of a speed-time graph represents the speed or average speed.
Bob's speed during the first part of his journey is 5 m/s.
During the traffic, Bob's speed is 1 m/s as he moves 20 meters in 20 seconds.
In the final stretch, Bob's speed is 6 m/s, covering 30 meters in 5 seconds.
A horizontal line on a distance-time graph indicates no movement, as distance isn't increasing.
Further information on speed-time graphs and acceleration is available in another video.
Encouragement to like and comment on science topics for future sketches.
Transcripts
Browse More Related Video
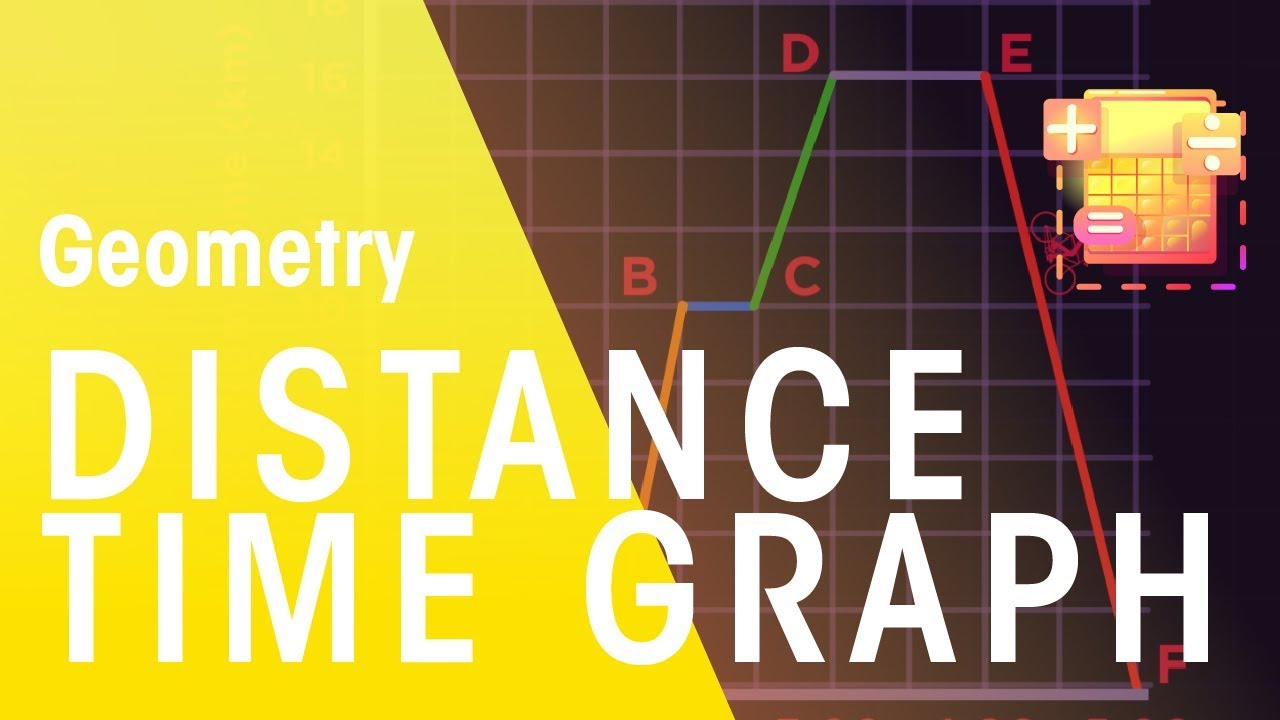
Distance Time Graphs | Geometry | Maths | FuseSchool
GCSE Physics - Distance-Time Graphs #53

GCSE Maths - Distance Time Graphs - Basic Introduction for Foundation GCSE (Some Higher)
Speed, Velocity and Distance Time Graphs - Physics - Science - Get That C In your GCSE and IGCSE
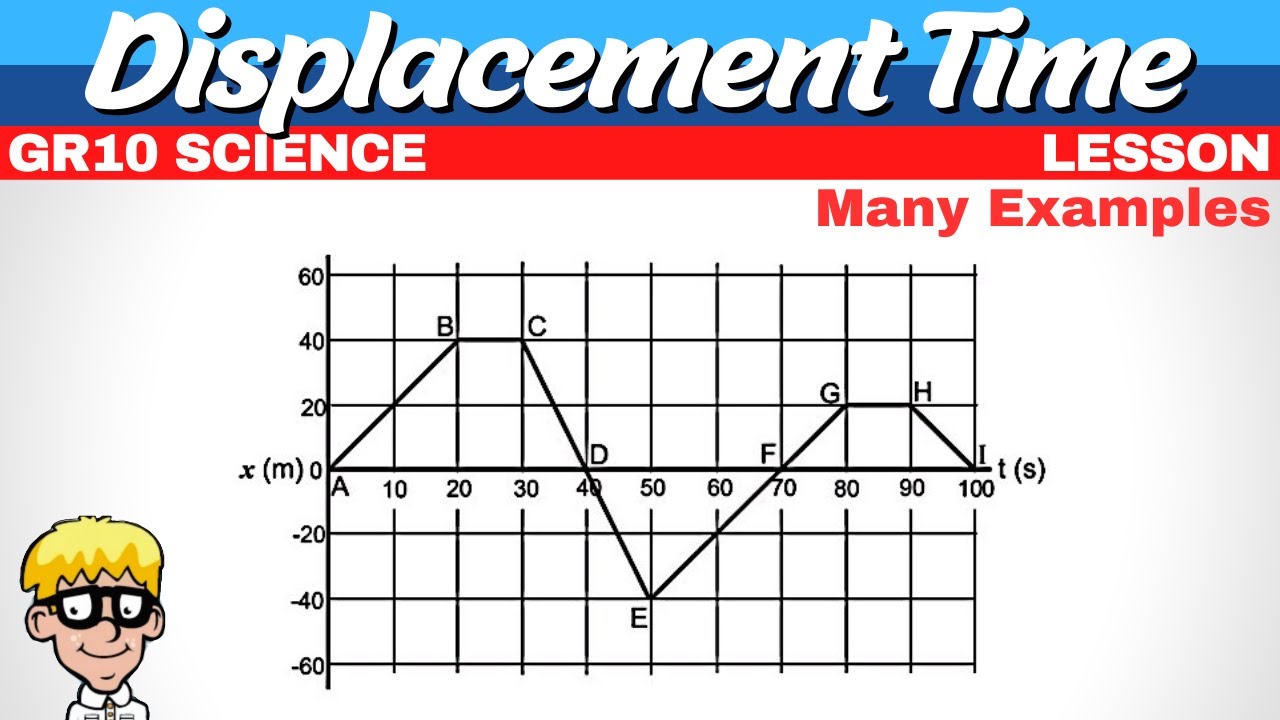
Displacement Time Graph Grade 10 Science
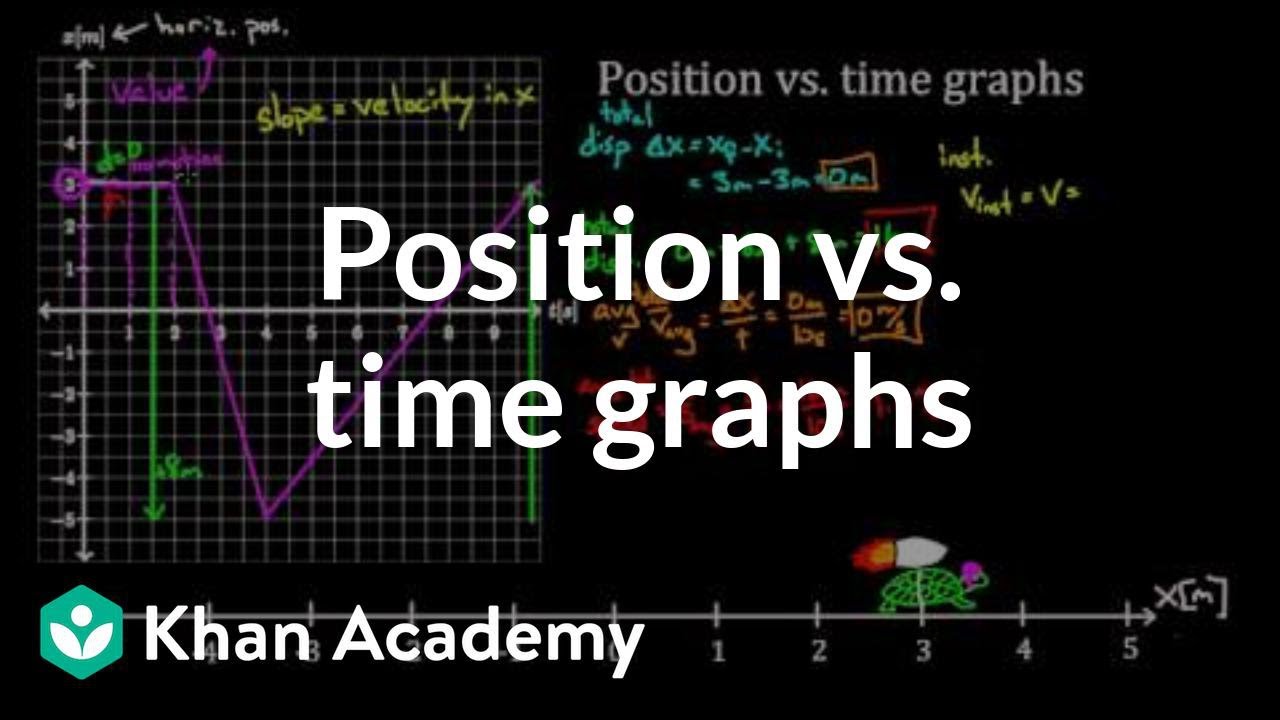
Position vs. time graphs | One-dimensional motion | Physics | Khan Academy
5.0 / 5 (0 votes)
Thanks for rating: