Position vs. time graphs | One-dimensional motion | Physics | Khan Academy
TLDRThe video script discusses the concept of position versus time graphs, emphasizing their utility in physics for compactly representing an object's motion without the need for lengthy equations or descriptions. It uses the analogy of a turtle with a jet pack to illustrate how to read and interpret the graph, explaining concepts such as displacement, distance traveled, average velocity, average speed, and instantaneous velocity. The key takeaway is that the slope of a position-time graph represents velocity, and for straight lines, the average and instantaneous slopes are identical, allowing for easy calculation of velocity and speed at any point.
Takeaways
- 📊 Position vs. time graphs are valuable in physics for compactly representing an object's motion without needing equations or extensive descriptions.
- 🐢 The example given is of a turtle with a jet pack, emphasizing safety with a helmet, to illustrate how the graph represents the turtle's motion.
- 🌀 The shape of the position graph does not mimic the path taken by the object; instead, it represents the object's horizontal position at different times.
- 📍 Reading the graph involves finding the point on the curve corresponding to a specific time and interpreting its position on the horizontal axis as the object's location.
- 🏁 A straight line on a position graph indicates no motion, as seen with the turtle not moving for the first two seconds.
- 🔄 Displacement can be calculated from the position graph by finding the change in position from the initial to the final time, which for the turtle was zero as it returned to the starting point.
- 🛣️ Total distance traveled is the sum of all individual path lengths the object takes, which for the turtle was 16 meters over the entire duration.
- 🚶♂️ Average velocity is displacement over time, and for the turtle's entire trip, it was zero because the total displacement was zero.
- 🏎️ Average speed is the total distance traveled divided by time, which the turtle achieved as 1.6 meters per second, accounting for both forward and backward motion.
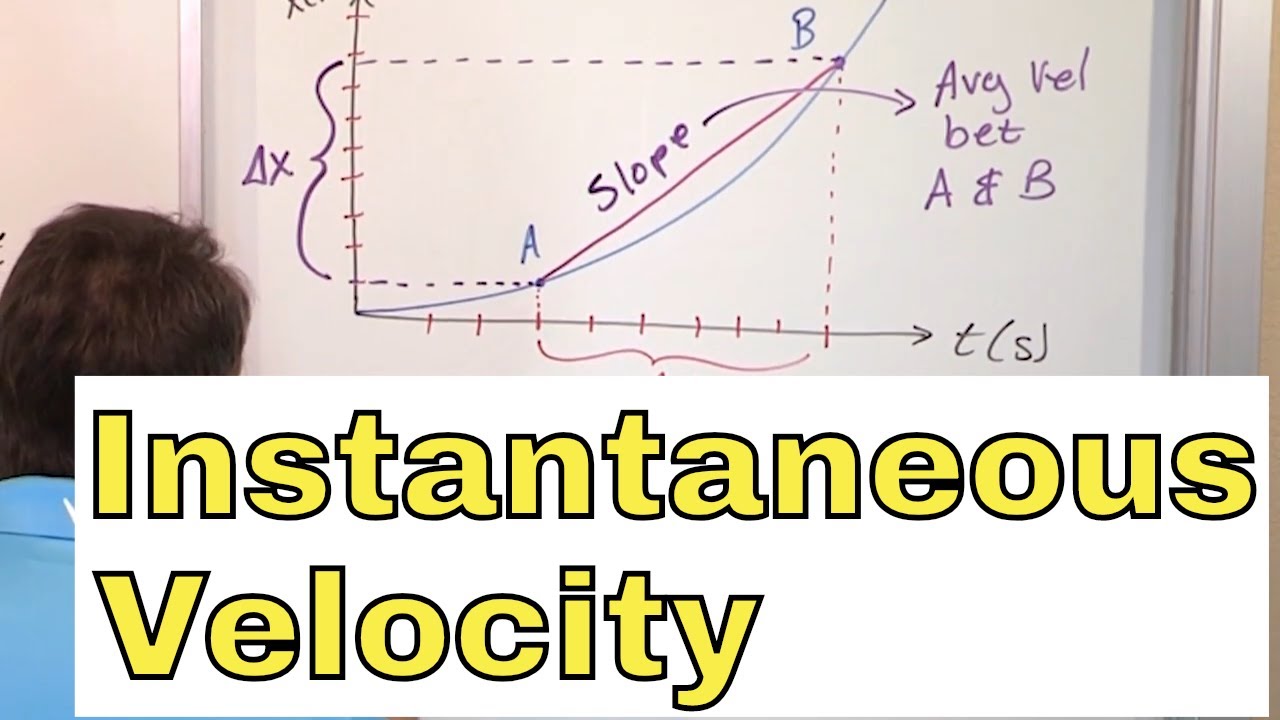
- 📈 The slope of a position vs. time graph represents velocity in the horizontal direction, with the instantaneous slope at any point on a straight line being equal to the average slope between any two points on that line.
- 🏃♀️ Instantaneous speed is the absolute value of instantaneous velocity, and if only horizontal motion is considered, it can be directly obtained from the graph regardless of the line's slope.
Q & A
What is the primary purpose of a position versus time graph?
-The primary purpose of a position versus time graph is to compactly represent the motion of an object, showing its entire movement轨迹 without the need for lengthy equations or descriptions.
Why are position versus time graphs loved by physicists and teachers?
-Physicists and teachers love position versus time graphs because they efficiently convey a lot of information about an object's motion in a small space, making it easier to analyze and understand complex motion patterns.
What does the horizontal axis (x-axis) represent in a position versus time graph?
-In a position versus time graph, the horizontal axis (x-axis) typically represents the horizontal position of the object being analyzed, measured in units appropriate to the context (e.g., meters).
How can you determine the object's position at a specific time from the graph?
-To determine the object's position at a specific time, you locate the point on the graph corresponding to that time on the horizontal axis, then move vertically to intersect the curve and horizontally to find the value on the vertical axis, which represents the position.
What does a straight horizontal line on a position versus time graph indicate?
-A straight horizontal line on a position versus time graph indicates that the object has not moved; it represents zero motion during the period the line extends across the time axis.
How can you calculate the displacement of an object using a position versus time graph?
-Displacement can be calculated by finding the final position and subtracting the initial position at any given time interval on the graph. The change in position (final minus initial) gives the displacement for that interval.
What is the difference between displacement and distance traveled?
-Displacement is the straight-line distance between the starting and ending positions of an object, while distance traveled is the total length of the path taken by the object, regardless of direction.
How can you determine the average velocity of an object from a position versus time graph?
-The average velocity is calculated by dividing the total displacement (change in position) by the total time taken for that displacement. If the object returns to its starting point, the total displacement and thus the average velocity would be zero.
What does the slope of a position versus time graph represent?
-The slope of a position versus time graph represents the velocity of the object in the horizontal direction. The steeper the slope, the greater the velocity; a horizontal line with zero slope indicates zero velocity.
How can you calculate the instantaneous velocity at a specific time from the graph?
-To calculate the instantaneous velocity at a specific time, you find the slope of the tangent to the curve at the point corresponding to that time. For straight lines, the instantaneous slope is the same as the average slope between any two points on the line.
What is the relationship between instantaneous speed and instantaneous velocity?
-Instantaneous speed is the magnitude of the instantaneous velocity. It represents the speed of the object at a specific moment without considering the direction of motion, while instantaneous velocity includes both speed and direction.
How can you calculate the average speed of an object using a position versus time graph?
-The average speed is calculated by dividing the total distance traveled by the object by the total time taken for the journey. It provides an overall measure of how fast the object moved, regardless of its direction.
Outlines
📈 Introduction to Position vs. Time Graphs
The instructor introduces the concept of position versus time graphs, emphasizing their importance in compactly representing the motion of objects without the need for equations or extensive descriptions. By using a whimsical example of a turtle with a jetpack (and a pink helmet for safety), the video illustrates common misconceptions about interpreting these graphs. The instructor clarifies that the shape of the graph does not represent the physical path of the object but rather its position over time. A horizontal axis labeled 'x' for horizontal position in meters is introduced, and the video explains how to read the graph to understand the turtle's motion, including periods of no movement and rapid changes in position. The section ends with a demonstration of how a horizontal line on a position graph signifies no motion, using the first two seconds of the turtle's journey as an example.
🚀 Analyzing Turtle's Motion Using the Graph
This section delves deeper into analyzing the turtle's motion as depicted by the position vs. time graph. It explains how to calculate displacement (delta x), emphasizing that it is the difference between the final and initial positions. In the example, the turtle's total displacement is zero, indicating no change in position from start to end. The video then differentiates between displacement and total distance traveled, highlighting that distance is always positive and, in this case, amounts to 16 meters. It also introduces concepts of average velocity (which is zero due to no net displacement) and average speed, calculated over the total journey. The average speed turns out to be 1.6 meters per second. The video stresses the distinction between average speed and instantaneous velocity, the latter derived from the slope of the graph at any given point. By examining straight line segments of the graph, the instructor illustrates how to calculate instantaneous velocity without calculus, using slope formula adaptations for physics.
📚 Physics Principles and Calculations
The third segment extends the discussion on interpreting position vs. time graphs by explaining why velocity equals the slope of such graphs. It revisits basic math principles of slope calculation, adjusting them for physics where the axes represent time (t) and horizontal position (x) instead of the typical y and x. This part of the video provides a step-by-step guide on calculating the instantaneous velocity of the turtle at three seconds, demonstrating the process of using two points on a straight line to find the slope and thereby the velocity. This explanation clarifies that on straight segments of the graph, the average slope between any two points equals the instantaneous slope at any point on the line. The segment concludes by addressing how to calculate instantaneous speed, essentially the magnitude of instantaneous velocity, assuming motion in a single direction.
🔍 Summary of Key Concepts
The final section succinctly recaps the major learning points of the video. It reinforces the idea that a position vs. time graph’s value provides the object's position, while the slope gives its velocity. The distinction between average and instantaneous velocities is highlighted, noting that they are identical for straight-line segments of the graph due to consistent slope. The segment wraps up by reiterating that the instantaneous speed is the magnitude of the instantaneous velocity, assuming the motion is unidirectional.
Mindmap
Keywords
💡position versus time graphs
💡horizontal position
💡displacement
💡distance traveled
💡average velocity
💡average speed
💡instantaneous velocity
💡instantaneous speed
💡slope
💡jet pack turtle
Highlights
Position versus time graphs are a compact way to represent an object's motion without needing equations or extensive verbal descriptions.
These graphs are particularly loved by physicists and teachers due to their usefulness in tests and providing a wealth of information about an object's motion.
The shape of the position versus time graph does not necessarily represent the path the object takes through space.
A horizontal line on a position graph indicates no motion, as seen with the turtle at the beginning of the example.
The turtle's motion is represented by a graph where the horizontal axis (x) represents the object's position and the vertical axis (t) represents time.
Displacement, represented by delta x, is calculated as the final position minus the initial position, and can be found between any two times on the graph.
Total distance traveled is the sum of all path lengths the object takes and is always a positive value, regardless of direction.
Average velocity is calculated as displacement over time, and for the turtle's entire trip, it was zero since there was no net displacement.
Average speed is the total distance traveled divided by time, and for the turtle, it was 1.6 meters per second over the 10-second period.
Instantaneous velocity can be found by looking at the slope of the position versus time graph, which represents the velocity in the horizontal direction.
For straight lines on the graph, the average slope between any two points equals the instantaneous slope at any point on the line, simplifying the process of finding instantaneous velocity without calculus.
The instantaneous speed is the magnitude of the instantaneous velocity, assuming only motion in one direction.
The value of the horizontal position versus time graph is in its ability to provide detailed information about an object's motion, such as position, velocity, and distance traveled.
Understanding these graphs is crucial for anyone studying physics as they are frequently used in tests and real-world applications.
The example of the turtle with a jet pack illustrates the practical application of interpreting position versus time graphs in a fun and engaging way.
The graph's interpretation allows for the differentiation between concepts like displacement, distance traveled, average velocity, and instantaneous velocity.
The method of reading a position versus time graph is universal, applicable to various objects and scenarios, making it a fundamental skill in physics.
Transcripts
Browse More Related Video
07 - What is Instantaneous Velocity?, Part 1 (Instantaneous Velocity Formula & Definition)

College Physics 1: Lecture 7 - Instantaneous Velocity

Velocity Time Graphs, Acceleration & Position Time Graphs - Physics
Average/Instantaneous Rates of Changes
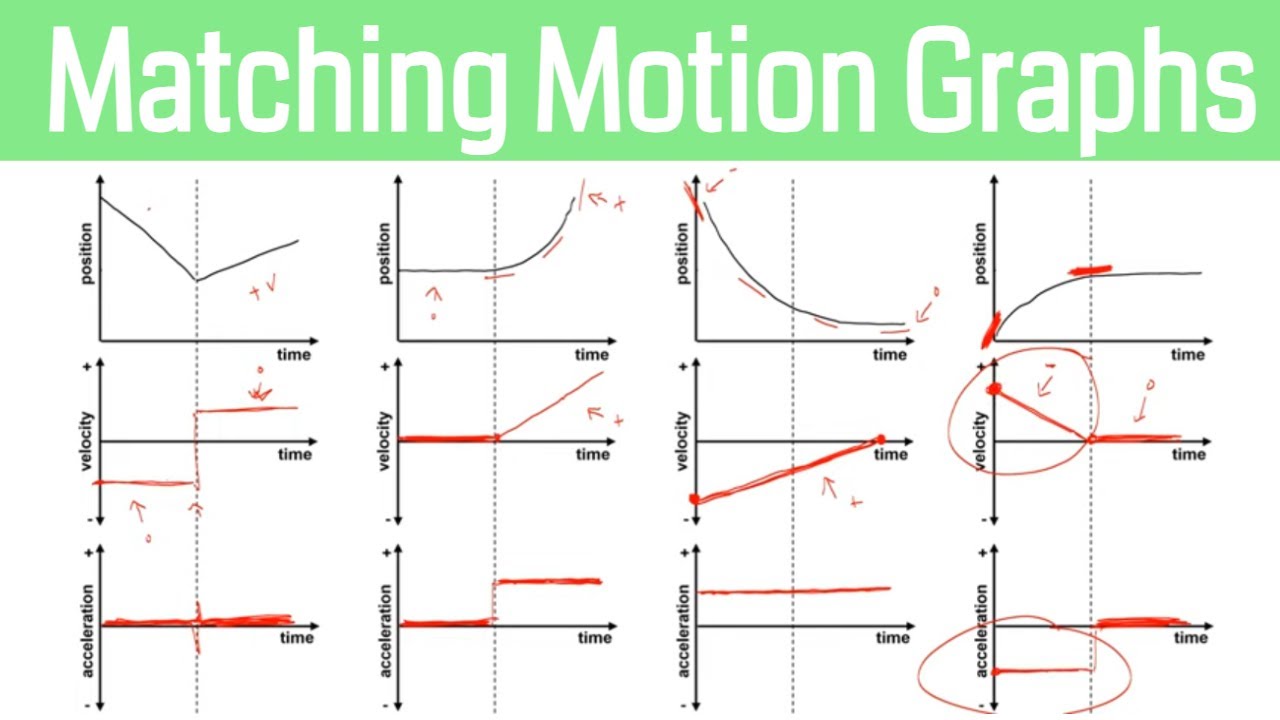
How to Match Motion Graphs in Physics
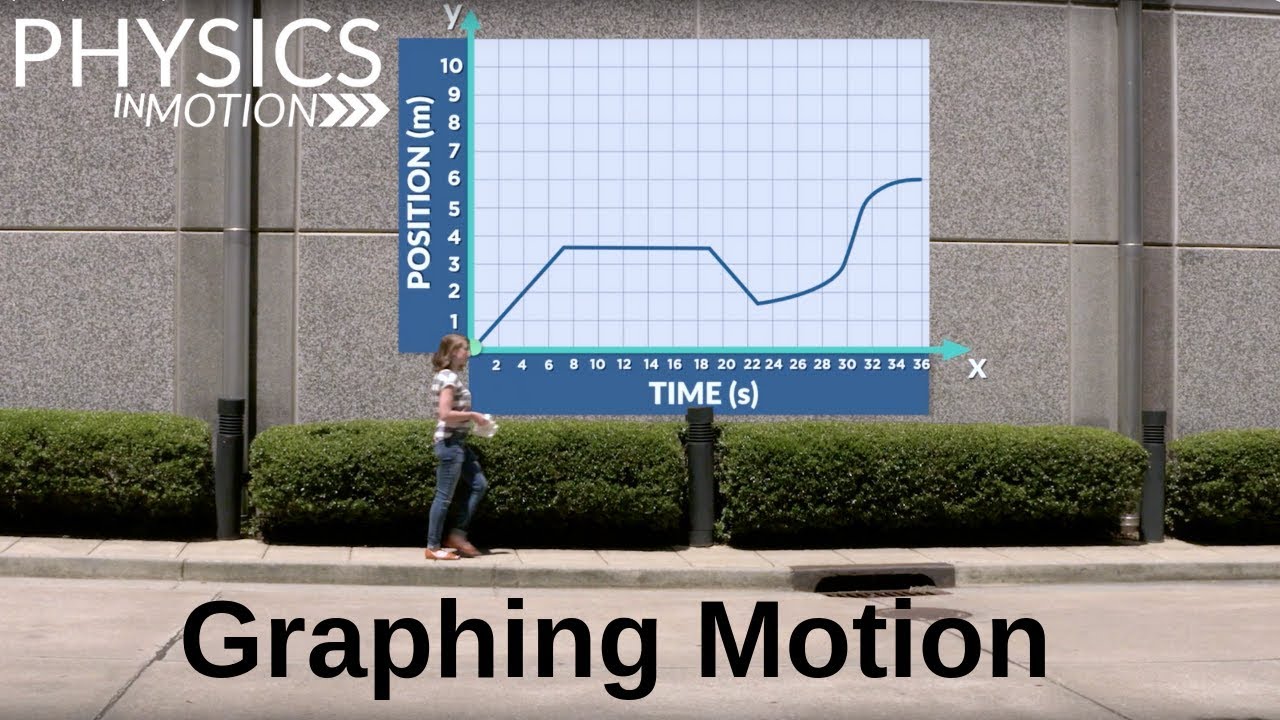
How Do You Graph Motion? | Physics in Motion
5.0 / 5 (0 votes)
Thanks for rating: