Distance Time Graphs | Geometry | Maths | FuseSchool
TLDRThis educational video teaches viewers about distance-time graphs and their practical application. The script follows Sam's journey from his house to his cousin's and sister's houses, using his travel to illustrate how to create and interpret a distance-time graph. It explains the concept of gradient as a measure of speed, demonstrating how to calculate it by dividing the change in distance by the change in time. The video also touches on the implications of a flat line indicating zero speed and a negative direction signifying travel in the opposite way. It concludes with a guide on how to determine speed from a graph and encourages viewers to engage with the content by liking, sharing, and asking questions.
Takeaways
- 🚴♂️ The video explains what a distance-time graph is and how to use it to analyze motion.
- 🏠 Sam's journey from his house to his cousin's, sister's, and back home is used as an example to illustrate the concept.
- 📈 The graph is formed by plotting distance on the y-axis and time on the x-axis.
- 🔍 A straight line on the graph indicates constant speed, as seen when Sam travels from his house to his cousin's.
- 🔢 The gradient (steepness) of a line on the graph represents speed, calculated by dividing the change in distance by the change in time.
- ⏱️ A flat line (horizontal) on the graph shows that the speed is zero, as during Sam's waiting period at his cousin's house.
- 📊 To find the speed from the graph, measure the gradient between two points by finding the change in distance and time.
- 🛣️ The highlighted line from A to B shows a speed of 20 kilometers per hour, calculated from a 10 km distance over 30 minutes (0.5 hours).
- 🚶♂️ The speed between points C and D is 12 kilometers per hour, derived from a 6 km distance over 30 minutes (0.5 hours).
- 📉 A completely flat line indicates no movement, while a negative line direction indicates travel in the opposite direction, like returning home.
- 🛤️ A curved line on the graph indicates a change in speed, with a flattening curve representing deceleration.
- 👍 The video encourages viewers to like, share, and ask questions in the comments for further assistance.
Q & A
What is a distance-time graph?
-A distance-time graph is a graphical representation that shows the relationship between the distance traveled and the time taken to travel that distance.
What does the straight line AB represent in Sam's journey on the distance-time graph?
-The straight line AB represents Sam traveling away from his house at a constant speed.
What does the flat line BC indicate on the distance-time graph?
-The flat line BC indicates that Sam's speed is zero, meaning he is not moving at all, as he is waiting at his cousin's house.
How is speed represented on a distance-time graph?
-Speed on a distance-time graph is represented by the steepness of the line, also known as the gradient.
How can you calculate the speed from a distance-time graph?
-To calculate speed from a graph, you measure the gradient by selecting two points, finding the change in distance and the change in time, and then dividing the change in distance by the change in time.
What was Sam's speed during the first part of his journey from his house to his cousin's house?
-Sam's speed during the first part of his journey was 20 kilometers per hour, calculated by dividing the 10-kilometer distance by the 0.5-hour time.
What does a steeper gradient on the graph indicate about the speed?
-A steeper gradient on the graph indicates a faster speed at that point.
What does a flatter gradient on the graph indicate about the speed?
-A flatter gradient indicates a slower speed, and a completely flat line means the speed is zero.
What does a negative line on the graph represent?
-A negative line on the graph represents the direction of travel being opposite, such as returning back home.
How can you determine if there is a change in speed or acceleration on the graph?
-A curved line that is curving upwards on the graph indicates a change in speed and acceleration. If the curve is flattening off, it shows a change in speed, which is deceleration.
What was Sam's speed when he was returning home from his sister's house?
-Sam's speed when returning home from his sister's house was 16 kilometers per hour, calculated with a distance change of 16 kilometers and a time change of one hour.
What should viewers do if they have questions about the distance-time graph concept?
-Viewers should leave a comment below the video if they have any questions about the distance-time graph concept, seeking further help.
Outlines
🚴♂️ Distance-Time Graph Basics
This section introduces the concept of a distance-time graph, a tool used to represent the movement of an object over time. The example of Sam cycling to various locations is used to illustrate how the graph is formed. Sam's journey, including the distances traveled and the waiting times, is detailed to show how the graph's straight and flat lines correspond to constant speed and stationary periods, respectively. The steepness of the line, known as the gradient, is key to determining speed, which is calculated by dividing the change in distance by the change in time. The explanation provides a step-by-step guide on how to interpret different sections of the graph to understand Sam's speed at various points during his trip.
Mindmap
Keywords
💡Distance Time Graph
💡Constant Speed
💡Gradient
💡Speed
💡Acceleration
💡Deceleration
💡Waiting
💡Direction of Travel
💡Change in Distance
💡Change in Time
💡Negative Direction
Highlights
Introduction to the concept of a distance-time graph and its usage.
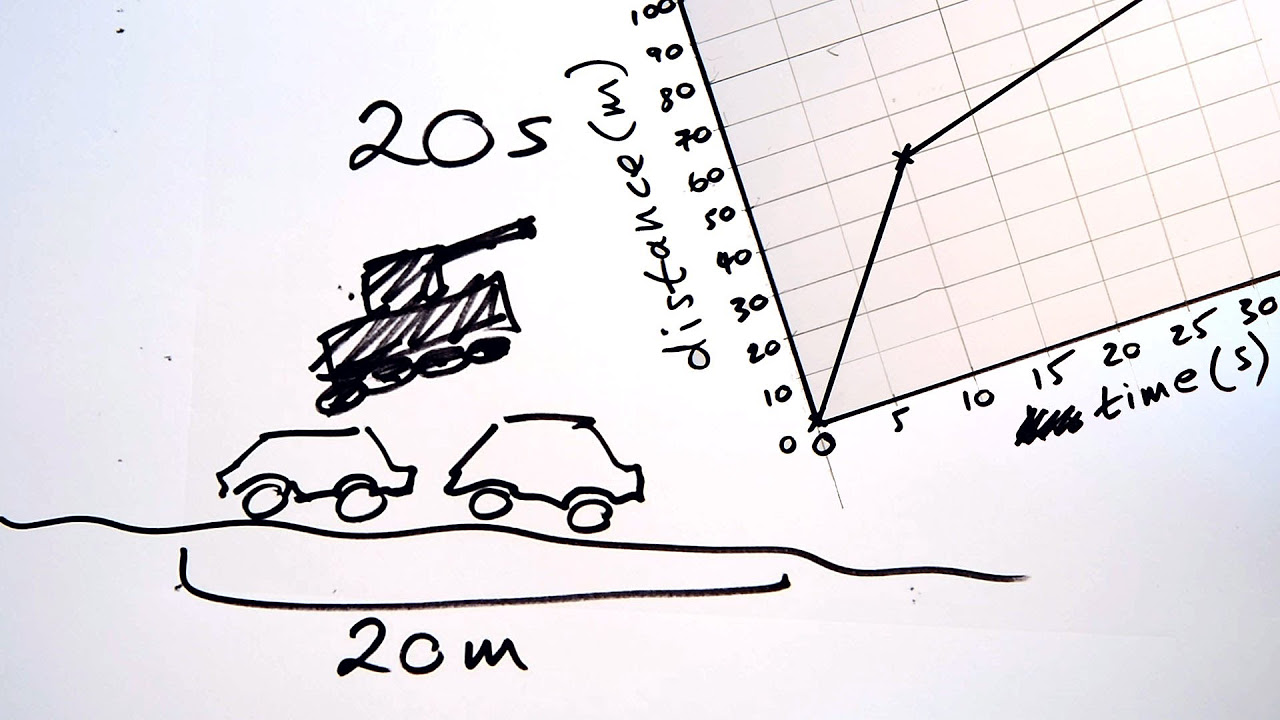
Illustration of Sam's journey from his house to his cousin's house, a distance of 10 kilometers in 30 minutes.
Explanation of how a straight line on the graph indicates constant speed.
The concept of gradient on a distance-time graph representing speed.
Method to calculate speed from a graph by measuring the gradient.
Demonstration of calculating speed using the change in distance and time for the segment A to B.
Calculation of Sam's speed as 20 kilometers per hour during his travel from A to B.
Description of a flat line (B to C) indicating zero speed due to Sam's waiting period.
Explanation of how to find the speed between points C and D on the graph.
Calculation of Sam's speed as 12 kilometers per hour for the segment C to D.
Interpretation of a steeper gradient indicating a faster speed and a flatter gradient indicating a slower speed.
Illustration of a negative line direction indicating travel in the opposite direction, such as returning home.
Calculation of Sam's speed as 16 kilometers per hour during his return journey.
Explanation of a curved line on the graph indicating a change in speed and acceleration.
Description of a flattening curve representing deceleration.
Final summary of how to find speed using a distance-time graph by calculating the gradient.
Encouragement for viewers to like, share, and comment with questions for further help.
Transcripts
Browse More Related Video
Distance-time graphs & speed - GCSE Science Shorts Sketch
GCSE Physics - Distance-Time Graphs #53
Displacement Time Graph Grade 10 Science

GCSE Maths - Distance Time Graphs - Basic Introduction for Foundation GCSE (Some Higher)

Average Speed | Forces & Motion | Physics | FuseSchool

SPEED, DISTANCE & TIME | GRADE 6
5.0 / 5 (0 votes)
Thanks for rating: