Absolute & Local Minimum and Maximum Values - Relative Extrema, Critical Numbers / Points Calculus
TLDRThe video script is an in-depth tutorial on identifying absolute and relative maximum and minimum values of functions. It explains the Extreme Value Theorem and how to apply it to various types of graphs. The concept of local extrema and how to determine them using the first derivative test is thoroughly discussed. The tutorial also covers the identification of critical numbers and how they relate to extrema. Several examples are worked out, including those with closed and open intervals, and the general shapes of common parent functions are used to predict extrema. The process of finding extrema for more complex functions involving absolute values and irrational exponents is also demonstrated.
Takeaways
- 📈 Understanding extrema involves identifying absolute and relative maximum and minimum values on a graph of a continuous function over a closed interval.
- 🔍 The Extreme Value Theorem states that if a function is continuous on a closed interval, it has both absolute and relative maximum and minimum values.
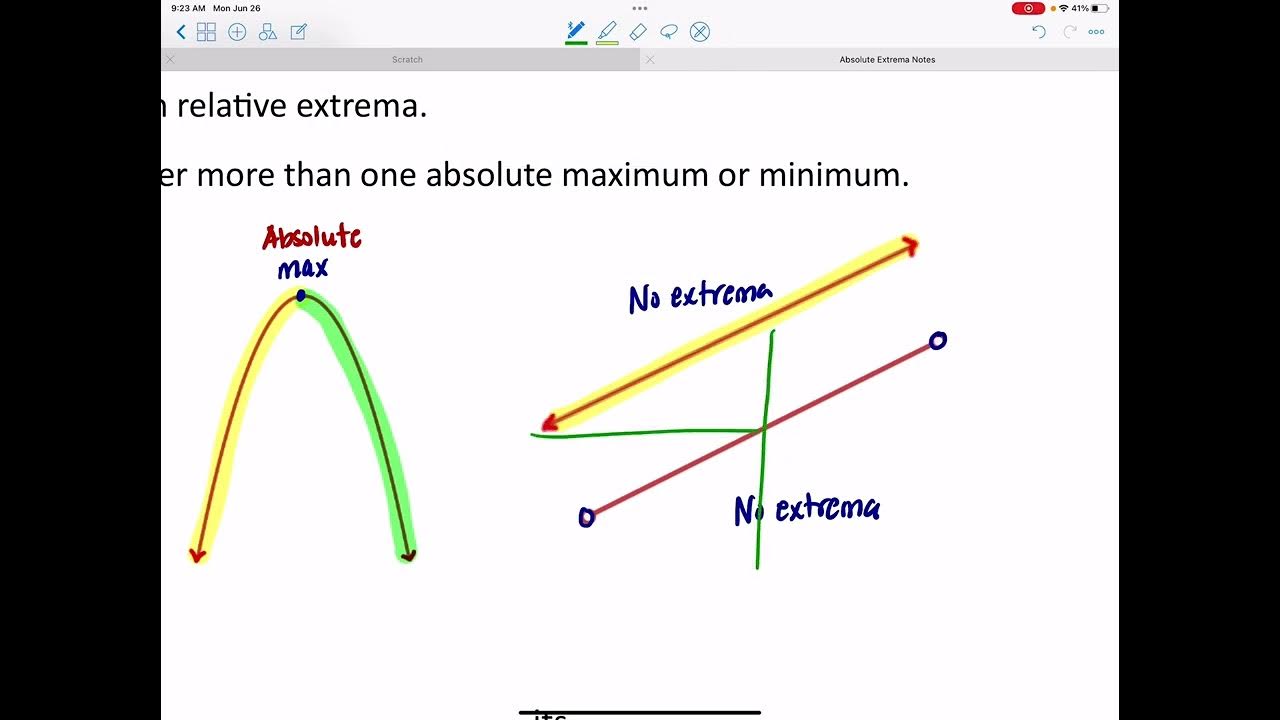
- 📊 Absolute extrema are the highest and lowest y-values on the graph over the interval, while relative extrema are local maximum or minimum points that are not necessarily absolute extrema.
- 🛠️ The First Derivative Test helps determine if a critical point is a local maximum, local minimum, or neither by analyzing the sign changes of the first derivative around that point.
- 🧭 Critical numbers are points where the first derivative is zero or undefined, and they are potential locations for local maxima or minima.
- 📌 To find extrema, first find the first derivative of the function, set it to zero to find critical numbers, and then use the First Derivative Test to classify these points.
- 📐 For functions with no closed interval, the general shape of the function (e.g., parabolas opening upward or downward, cubic functions) can indicate the presence of absolute extrema.
- 🔢 The y-coordinate of a local extremum gives its value, while the x-coordinate indicates its location on the graph.
- 📈 When dealing with absolute value functions, the shape of the graph (V-shaped) helps in identifying the local and absolute minimum or maximum values without the need for the first derivative.
- 🌟 Memorizing parent functions and their general shapes (e.g., x^n where n is even or odd) can help quickly determine the presence of absolute extrema.
Q & A
What is the difference between absolute and relative extrema?
-Absolute extrema refer to the highest or lowest y-values on the graph of a function within a given interval, while relative extrema are local maximum or minimum points that can exist within the graph but are not necessarily the overall highest or lowest points.
How does the Extreme Value Theorem relate to finding absolute extrema?
-The Extreme Value Theorem states that if a function is continuous on a closed interval [a, b], then it must have both an absolute maximum and an absolute minimum on that interval.
What is the significance of a closed circle on a graph in relation to absolute extrema?
-A closed circle on a graph indicates that the function has reached a point of extrema and has not continued beyond it. This is important for identifying absolute extrema because without a closed circle, one cannot be certain that the point is the highest or lowest on the graph.
What is the First Derivative Test and how is it used to identify local extrema?
-The First Derivative Test is a method used to determine whether a critical point is a local maximum, local minimum, or neither. It involves analyzing the sign of the first derivative of the function around the critical point: if the derivative changes from positive to negative, there is a local maximum; if it changes from negative to positive, there is a local minimum.
How do you find the critical numbers of a function?
-Critical numbers are the values of x for which the first derivative of the function is either zero or undefined. To find them, you first calculate the first derivative of the function and then set it equal to zero (or undefined) and solve for x.
What is the relationship between the shape of a function's graph and its extrema?
-The shape of a function's graph can provide insights into its extrema. For example, a parabola that opens upward will have a local and absolute minimum at its vertex, while a parabola that opens downward will have a local and absolute maximum at its vertex. Functions with odd exponents as the leading term (e.g., x^3) do not have absolute extrema, whereas even exponents (e.g., x^2) can have absolute extrema depending on whether the leading term is positive or negative.
How can you determine if a function has no absolute maximum or minimum?
-A function may not have absolute extrema if its graph continues indefinitely in one direction (e.g., a cubic function with a positive leading term like x^3 will always increase). Similarly, a function with a negative leading term like -x^3 will continue to decrease without bound. Additionally, certain shapes like the absolute value function or functions with cusps do not have absolute extrema.
What is the role of the first derivative in identifying extrema?
-The first derivative of a function provides information about the slope of the function at any given point. At points where the first derivative is zero or undefined, the function may have a local extremum. The sign of the first derivative changes around these points, which helps determine whether the point is a local maximum or minimum.
How does the graph of a function with an odd exponent as the leading term behave?
-A function with an odd exponent as the leading term (e.g., x^3, x^5) will not have any absolute extrema. The graph will either continue to increase indefinitely or decrease indefinitely, depending on whether the exponent is positive or negative.
What is the significance of the vertex form of a quadratic function?
-The vertex form of a quadratic function, f(x) = a(x - h)^2 + k, shows the parabola's vertex as the point (h, k). The axis of symmetry is the vertical line x = h, and the vertex represents the maximum or minimum value of the parabola depending on the coefficient a. This form is particularly useful for quickly identifying the extremum of the function.
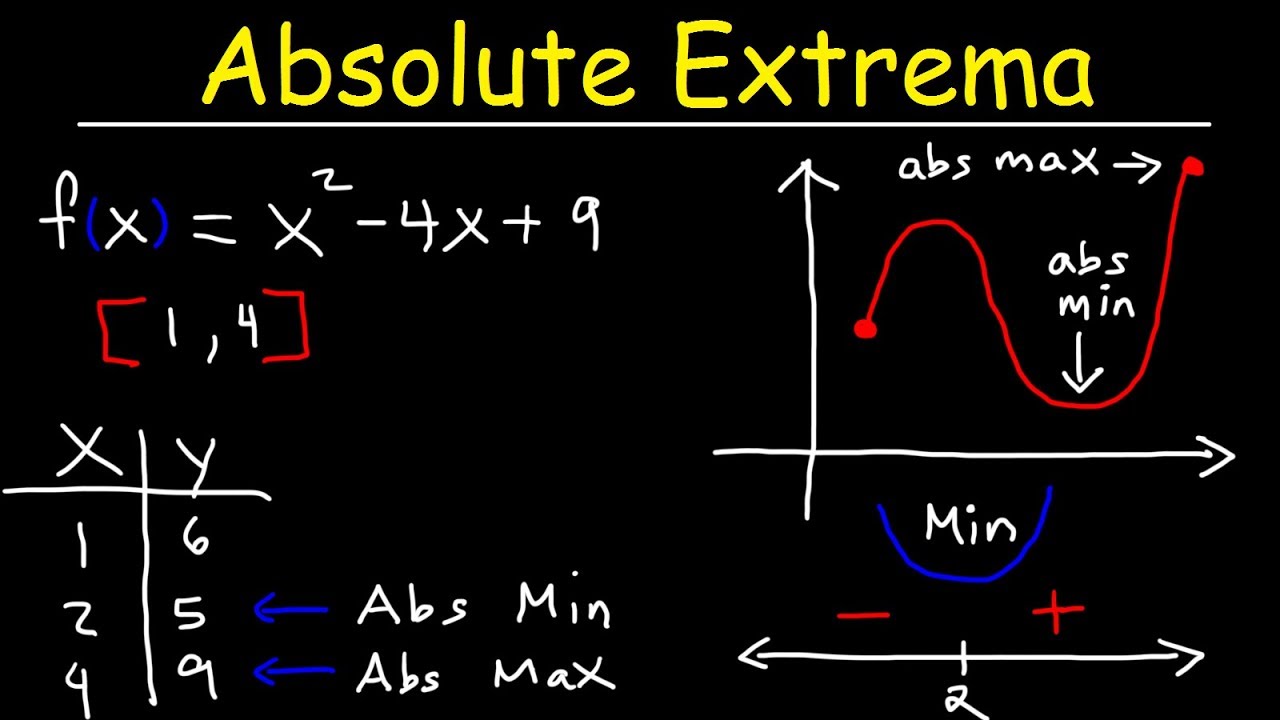
How do you find the extrema of a function on a restricted interval?
-To find the extrema of a function on a restricted interval, you first find the critical points within the interval and the endpoints. Then, you evaluate the function at these points to determine the local extrema. Finally, you compare the y-values to find the absolute maximum and minimum within the interval.
Outlines
📈 Introduction to Absolute and Relative Extrema
This paragraph introduces the concept of absolute and relative extrema in the context of a graphed function. It explains that for a continuous function on a closed interval, there exists an absolute maximum and minimum. The absolute maximum is the highest point on the graph, while the absolute minimum is the lowest point. It also distinguishes between local or relative maxima and minima that can occur within the graph and how they are typically found in the middle of the graph where the function transitions from increasing to decreasing or vice versa.
📊 Utilizing the First Derivative Test
The paragraph delves into the first derivative test, a method for determining local maxima and minima. It explains that the first derivative of a function indicates whether the function is increasing or decreasing. The first derivative test involves looking for points where the first derivative changes from positive to negative (indicating a local maximum) or from negative to positive (indicating a local minimum). The paragraph also discusses identifying critical numbers, which are points where the first derivative is zero or undefined, as potential locations for local extrema.
🔢 Identifying Critical Numbers and Extrema
This section provides a step-by-step guide on how to find critical numbers and identify all types of extrema within a function. It explains the process of setting the first derivative equal to zero to find critical numbers and using the first derivative test to determine whether these points are local maxima, local minima, or neither. The paragraph also emphasizes the importance of understanding the shape of the function's graph, particularly for functions with no closed interval, to determine if there are absolute maximum or minimum values.
🌐 Understanding the Shapes of Functions
The paragraph discusses the general shapes of various functions and how these shapes can inform us about the presence of absolute minima or maxima. It explains that functions with a parabola opening upward will have a local minimum that is also the absolute minimum, while those opening downward will have a local maximum that is the absolute maximum. The paragraph also covers the behavior of cubic functions, noting that those with an odd leading term exponent do not have absolute extrema, whereas those with an even leading term exponent may have them depending on the sign of the leading term.
📚 Applying the First Derivative Test to Examples
This paragraph applies the first derivative test to several examples to illustrate the process of identifying local and absolute extrema. It walks through the steps of finding the first derivative, setting it to zero to find critical numbers, and using the sign of the first derivative to determine the nature of the extrema at those points. The examples cover a range of functions, including polynomial, absolute value, and radical functions, demonstrating how to handle different types of mathematical expressions and intervals.
🧠 Challenging Examples and Problem Solving
The paragraph presents more complex examples and encourages the viewer to pause and attempt to solve them independently. It involves finding the first derivative, identifying critical points, and using the first derivative test to determine the nature of the extrema. The examples include functions with more complicated derivatives and restricted intervals, requiring the viewer to consider the behavior of the function within the given domain and compare endpoint values to find absolute extrema.
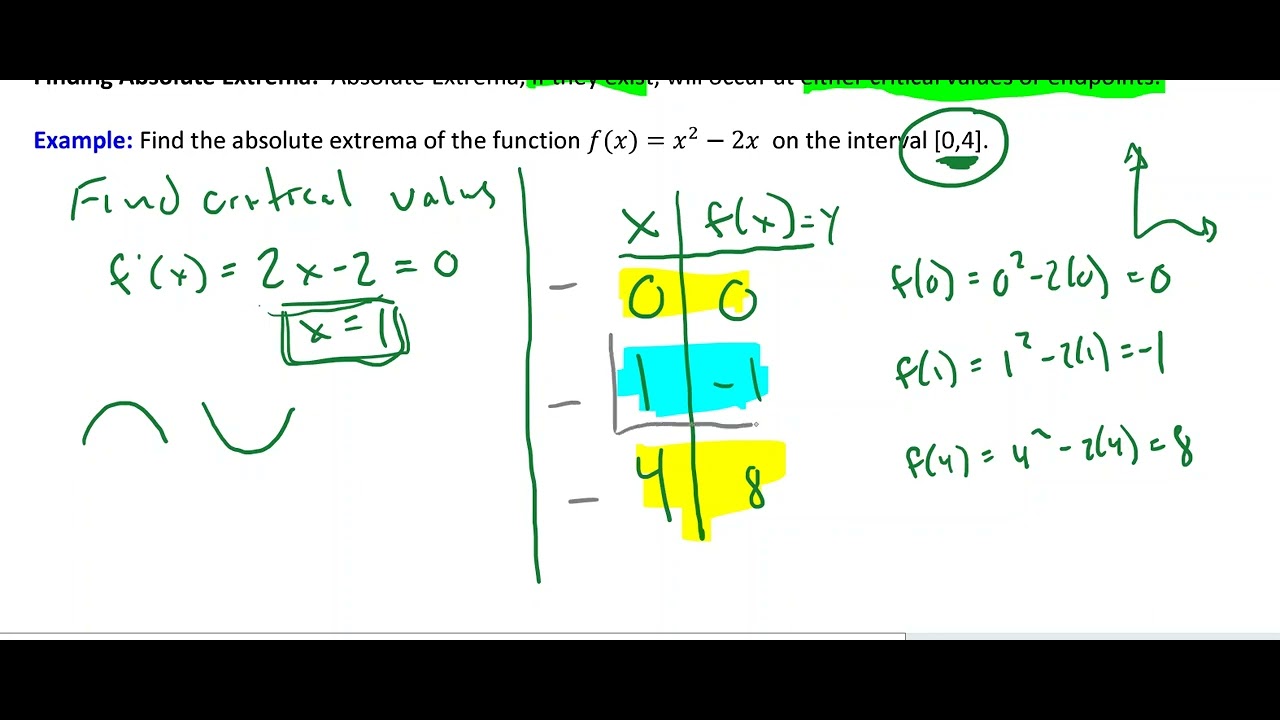
📈 Determining Extrema on Restricted Intervals
This section focuses on finding absolute extrema on restricted intervals. It explains the process of finding the first derivative, setting it to zero for critical points, and then testing values within the interval to determine local extrema. The paragraph emphasizes the need to compare critical point values with interval endpoints to find the absolute maximum and minimum values. The examples provided illustrate how to work with quadratic functions on closed intervals and how to construct a table to compare y-values and identify the absolute extrema.
📊 Analyzing Functions with Complex Derivatives
The paragraph discusses the analysis of functions with complex derivatives, such as those involving quotients or products of functions. It explains the use of the quotient rule and product rule to find the first derivative and then how to set this derivative to zero to find critical points. The paragraph also covers the process of simplifying the first derivative and making a sign chart to determine the nature of the extrema at these critical points. The examples given demonstrate the application of these concepts to more advanced functions.
🔢 Calculating Extrema within Restricted Domains
This section deals with the calculation of extrema within restricted domains, focusing on how to handle functions that are not defined for all real numbers. It explains how to find critical numbers and determine the nature of the extrema within the given interval. The paragraph also highlights the importance of ensuring that the critical numbers are within the domain of the function and provides a method for comparing values at critical points and endpoints to find the absolute maximum and minimum within the restricted interval.
Mindmap
Keywords
💡Absolute Maximum
💡Absolute Minimum
💡Relative Maximum
💡Relative Minimum
💡First Derivative Test
💡Critical Numbers
💡Continuous Function
💡Open Circle
💡Closed Circle
💡Vertical Asymptote
💡Parabola
Highlights
Exploring the concepts of absolute and relative maximum and minimum values in the context of calculus.
Discussing the Extreme Value Theorem and its implications for continuous functions on closed intervals.
Describing the identification of absolute maximum and minimum points on a graph through specific conditions.
Distinguishing between local (relative) extrema and absolute extrema with examples and illustrations.
Explaining the significance of closed and open circles on a graph in relation to absolute extrema.
Introducing the First Derivative Test for determining local maxima and minima of a function.
Demonstrating how to identify critical numbers by setting the first derivative equal to zero or where it does not exist.
Applying the First Derivative Test to specific functions to find local maxima and minima.
Analyzing the general shape of functions like parabolas and cubic functions to predict their extrema behavior.
Discussing the role of even and odd exponents in determining the existence of absolute extrema.
Providing a step-by-step approach to finding extrema for a given function, including critical numbers and the First Derivative Test.
Illustrating the process of finding extrema with examples of different types of functions, such as absolute value functions and power functions.
Explaining the importance of considering the domain and interval of a function when determining absolute extrema.
Demonstrating how to use the quotient rule to find the first derivative of a function to identify critical points.
Conducting a comprehensive analysis of a function with a restricted interval to determine local and absolute extrema.
Using the product rule to find the derivative of a function involving a product of two functions, and applying it to extrema problems.
Providing a clear and detailed explanation of the process for finding extrema, including the use of number lines, sign charts, and tables for comparison.
Transcripts


5.0 / 5 (0 votes)
Thanks for rating: