Finding Absolute Maximum and Minimum Values - Absolute Extrema
TLDRThis educational video script focuses on identifying absolute and relative extrema of a function. It explains the concepts of absolute maximum and minimum, which are the highest and lowest points on a graph, and relative extrema, which are the highest or lowest points in a local area. The script uses a step-by-step approach to illustrate how to find these points by setting the first derivative equal to zero to find critical points, and then using a sign chart to determine if these points are relative maxima or minima. It provides a clear methodology for solving problems involving finding extreme values of functions within a given interval, complete with examples and detailed calculations.
Takeaways
- 📈 To find absolute extrema, compare the Y values of the graph to identify the highest (maximum) and lowest (minimum) points.
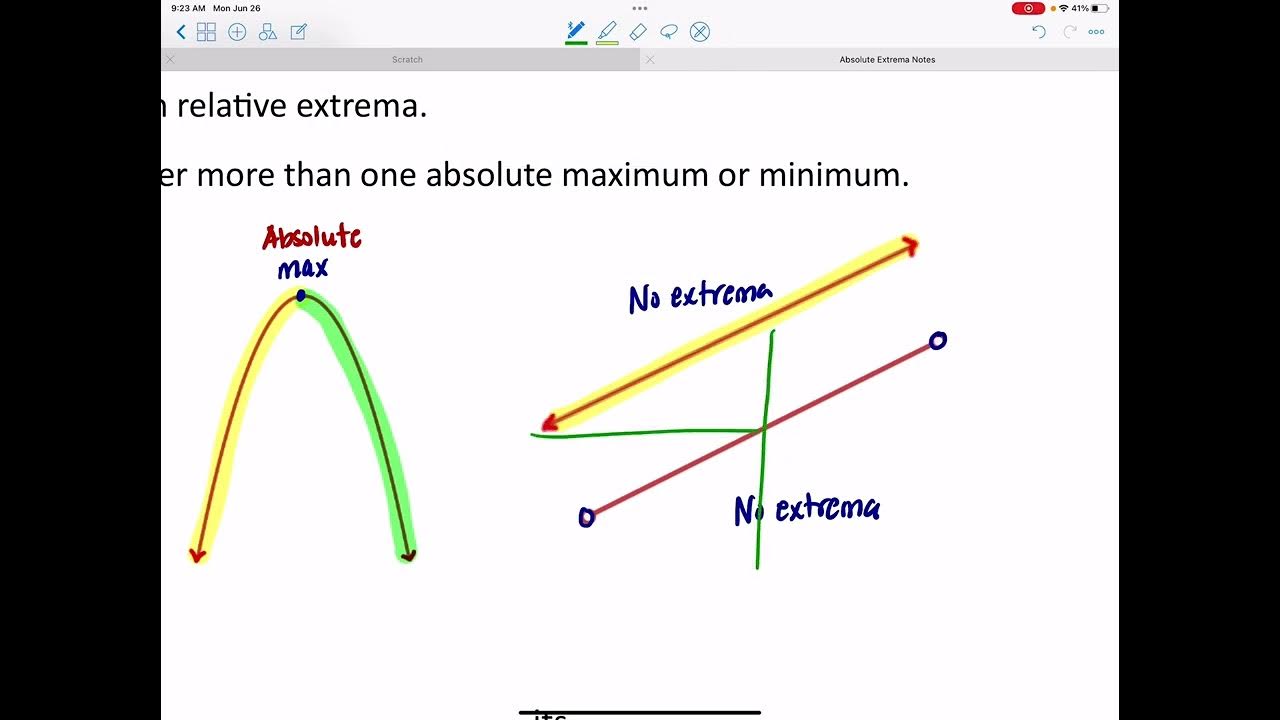
- 🔍 Relative extrema are local maxima or minima, which are the highest or lowest points in a specific area of the graph.
- 🧭 To locate relative extrema, find where the slope (first derivative) is zero, indicating a horizontal tangent line.
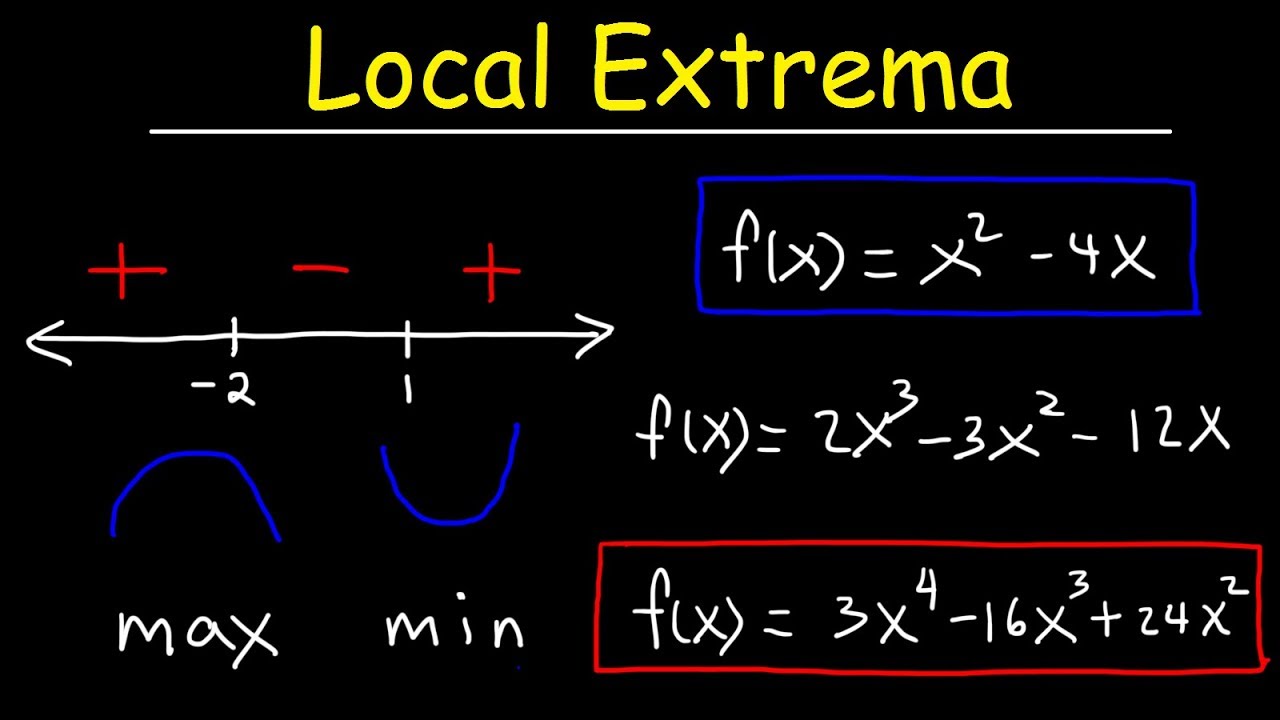
- 📊 Create a sign chart to determine the slope changes around critical points, which helps identify if a critical point is a relative maximum or minimum.
- 🔢 For the function f(x) = x^2 - 4x + 9, the relative minimum is at x=2 and the absolute minimum and maximum within the interval [1, 4] are 5 and 9 respectively.
- 📈 For the function f(x) = 4x^3 - 30x^2 + 90x + 2, the critical numbers are x=5 and x=3/2 (1.5), with the relative maximum at x=1.5 and minimum at x=5.
- 🔢 The absolute maximum value within the interval [1, 6] for the second function is 62.75 at x=1.5, and the absolute minimum is -23 at x=5.
- 🌟 Always include the endpoints of the interval and critical points when creating a table to compare Y values for absolute extrema.
- 📝 When working with polynomial functions, find the first derivative and set it equal to zero to find critical points.
- 🔄 Factor the first derivative if possible to simplify the process of finding critical numbers.
- 🤔 Remember that endpoints can sometimes coincide with relative or absolute extrema, so they must be included in the comparison process.
- 📈 Understanding the behavior of a function, such as where it is increasing or decreasing, is crucial for identifying extrema.
Q & A
What are the main topics covered in the lesson?
-The lesson focuses on identifying the locations of absolute maximums and minimums of a function, as well as relative extrema. It explains the difference between absolute and relative extrema and provides methods to find them using a graph, a data table, and the first derivative of a function.
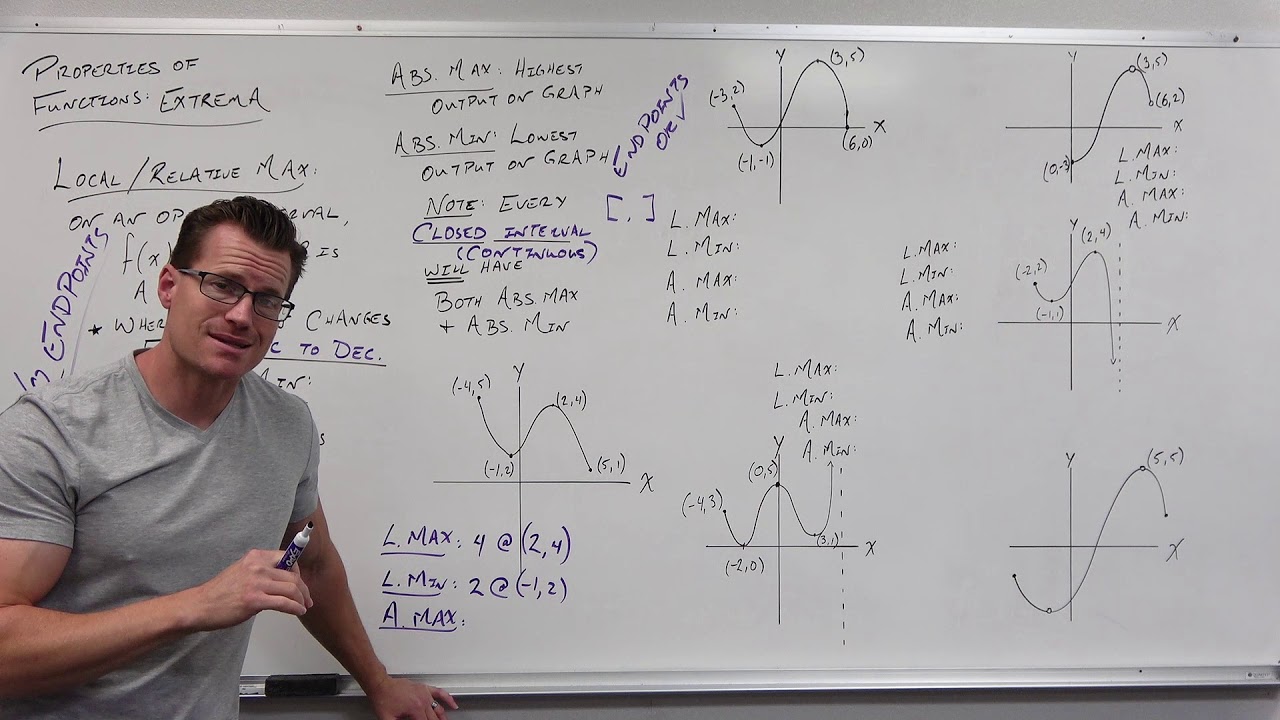
What is the definition of an absolute maximum in a graph?
-An absolute maximum is the highest point on a graph. It represents the greatest y-value among all the points on the graph.
How is an absolute minimum defined?
-An absolute minimum is the lowest point on a graph, representing the smallest y-value among all the points on the graph.
What is a relative maximum in the context of the lesson?
-A relative maximum, also known as a local maximum, is the highest point in a local area of the graph. It is not necessarily the highest point on the entire graph but is the maximum within its surrounding region.
What is a relative minimum in the context of the lesson?
-A relative minimum, or local minimum, is the lowest point in a local area of the graph. It is not necessarily the lowest point on the entire graph but is the minimum within its surrounding region.
How can you identify the location of absolute extrema?
-To identify the location of absolute extrema, you compare the y-values of all points on the graph, including the endpoints of the interval and any critical points found by analyzing the function.
What is the process for finding relative extrema?
-To find relative extrema, you first calculate the first derivative of the function. Then, you identify critical points where the derivative is zero or undefined. The slope of the tangent line at these points helps determine whether they are relative maxima or minima.
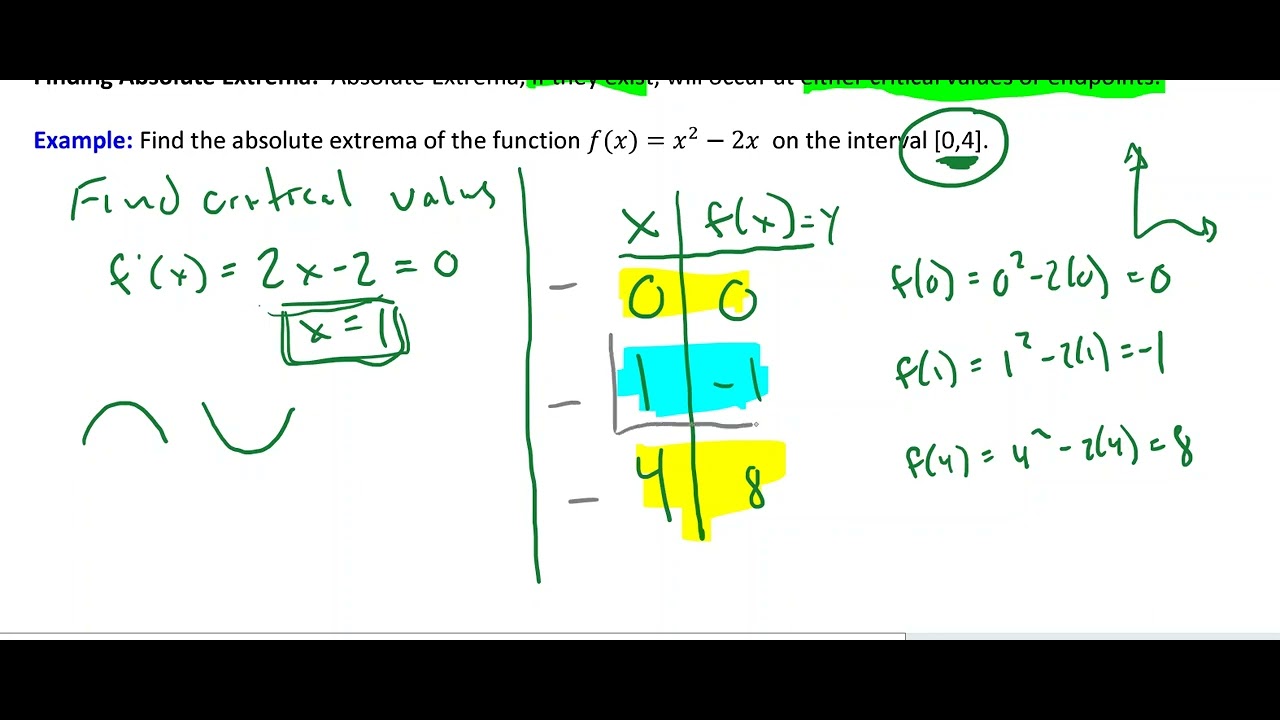
What is the first step in solving the practice problem with the function f(x) = x^2 - 4x + 9?
-The first step is to find the derivative of the function, which is f'(x) = 2x - 4. Then, you set the derivative equal to zero to find the critical points, solve for x, and evaluate the function at these points to identify any relative extrema.
How do you determine if a critical point is a relative maximum or minimum?
-You create a sign chart by testing the sign of the first derivative on both sides of the critical point. If the derivative changes from positive to negative, it indicates a relative maximum. If it changes from negative to positive, it indicates a relative minimum.
What is the method to find the absolute extreme values of a function?
-After identifying all critical points, you make a table including the endpoints of the interval and the critical points. Then, you calculate the y-values for each x-value in the table and compare them to find the highest and lowest y-values, which correspond to the absolute maximum and minimum, respectively.
In the second practice problem with the function f(x) = 4x^3 - 30x^2 + 90x + 2, how do you find the critical points?
-You find the first derivative, f'(x) = 12x^2 - 60x + 90. Then, you set the first derivative equal to zero and solve for x to find the critical points. After simplifying the derivative and factoring, you set each factor equal to zero to find the critical numbers.
What is the absolute maximum value of the function f(x) = 4x^3 - 30x^2 + 90x + 2 on the interval [1, 6]?
-The absolute maximum value of the function on the interval [1, 6] is 60, which occurs at x = 1.
What is the absolute minimum value of the function f(x) = 4x^3 - 30x^2 + 90x + 2 on the interval [1, 6]?
-The absolute minimum value of the function on the interval [1, 6] is -23, which occurs at x = 5.
Outlines
📈 Identifying Absolute and Relative Extrema
This paragraph introduces the concept of absolute and relative extrema in the context of a function's graph. It explains that the absolute maximum is the highest point on the graph, while the absolute minimum is the lowest. The paragraph also describes relative maximums and minimums as the highest and lowest points in a local area. The process of identifying the locations of these extrema is outlined, emphasizing the need to compare Y values for absolute extrema and to find points where the slope (first derivative) is zero for relative extrema.
📚 Solving a Practice Problem
The paragraph presents a practice problem involving the function f(x) = x^2 - 4x + 9. It details the steps to identify the absolute and relative extreme values of the function within the interval between 1 and 4. The process includes finding critical points by setting the first derivative equal to zero, creating a sign chart to determine the slope changes, and evaluating the function at critical points and endpoints to find the Y values. The paragraph concludes with the identification of a relative minimum at x=2 and absolute extrema at the endpoints of the interval.
🧠 Tackling a Second Function for Extrema
This paragraph introduces a second function, f(x) = 4x^3 - 30x^2 + 90x + 2, and guides through the process of finding its absolute and relative extreme values on the interval from 1 to 6. It explains the calculation of the first derivative and setting it to zero to find critical points. The paragraph then describes factoring the derivative and using a sign chart to determine the nature of the critical points (maximum or minimum). The process involves evaluating the function at critical points and endpoints to determine the Y values and identify the absolute maximum and minimum.
📊 Analyzing Results and Conclusion
The final paragraph summarizes the results of the previous analysis, identifying the absolute maximum and minimum values of the second function on the given interval. It highlights that the highest Y value represents the absolute maximum, while the lowest Y value is the absolute minimum. The paragraph also notes that the locations of these extrema are associated with their respective x and y coordinates. It concludes by emphasizing the importance of comparing Y values for all critical points and endpoints to determine the absolute and relative extrema within a closed interval.
Mindmap
Keywords
💡Absolute Maximum
💡Absolute Minimum
💡Relative Maximum
💡Relative Minimum
💡Critical Points
💡First Derivative
💡Sign Chart
💡Slope
💡Y Values
💡Interval
💡Factoring
Highlights
The lesson focuses on identifying absolute maximums and minimums of a function. (Start Time: 0s)
Visual understanding is emphasized through graph analysis. (Start Time: 10s)
Absolute maximum is the highest point on a graph, while absolute minimum is the lowest. (Start Time: 20s)
Relative extrema are local maxima or minima within a specific area of the graph. (Start Time: 30s)
To find absolute extrema, compare Y values, potentially using a data table. (Start Time: 40s)
Relative extrema locations are identified where the slope is zero, indicated by a horizontal tangent line. (Start Time: 50s)
The first derivative test is used to find the location of relative extrema. (Start Time: 1m)
A practice problem is introduced with the function f(x) = x^2 - 4x + 9. (Start Time: 1m 10s)
Critical points are identified by setting the first derivative equal to zero. (Start Time: 1m 20s)
A sign chart helps determine if a critical point is a relative maximum or minimum. (Start Time: 1m 30s)
The absolute extreme values are found by evaluating the function at endpoints and critical points. (Start Time: 1m 40s)
The highest Y value indicates the absolute maximum, and the lowest indicates the absolute minimum. (Start Time: 1m 50s)
Another practice problem is introduced with the function f(x) = 4x^3 - 30x^2 + 90x + 2. (Start Time: 2m)
Critical numbers are found by setting the first derivative equal to zero and factoring. (Start Time: 2m 10s)
Sign chart analysis helps in identifying the nature of critical points as relative maximums or minimums. (Start Time: 2m 20s)
A table is constructed with endpoints and critical numbers to determine absolute extreme values. (Start Time: 2m 30s)
The highest and lowest Y values from the table indicate the absolute maximum and minimum, respectively. (Start Time: 2m 40s)
Endpoints and critical points are evaluated to confirm their nature as absolute or relative extrema. (Start Time: 2m 50s)
Transcripts
Browse More Related Video

Finding Relative Extrema
Finding Absolute Extrema
Properties of Functions - Extrema (Precalculus - College Algebra 10)
Absolute Extrema
Finding Local Maximum and Minimum Values of a Function - Relative Extrema

How to recognize relative and absolute maxima and minima | Functions | Algebra I | Khan Academy
5.0 / 5 (0 votes)
Thanks for rating: