Concavity, Inflection Points, and Second Derivative
TLDRThe video script offers a comprehensive guide on identifying inflection points and determining the intervals of concavity for a function. It explains that concavity is indicated by the sign of the second derivative, with positive for concave up and negative for concave down. Inflection points occur where the second derivative is zero and concavity changes. The script provides detailed examples, illustrating how to find derivatives, set up sign charts, and calculate inflection points as ordered pairs, enhancing the viewer's understanding of these mathematical concepts.
Takeaways
- 📈 Understanding concavity is crucial for identifying inflection points; a function is concave up when the second derivative is positive and concave down when it is negative.
- 🔍 Inflection points are found where the second derivative equals zero and there is a change in concavity, either from positive to negative or vice versa.
- 🌐 The graph of a function that is concave up everywhere will have a shape that curves upwards, while a function that is concave down will curve downwards.
- 🧠 A function's concavity can be determined by analyzing the sign of its second derivative; positive indicates concave up, and negative indicates concave down.
- 🔢 To find inflection points, first calculate the first and second derivatives of the function, then set the second derivative equal to zero to solve for potential inflection points.
- 📊 Create a sign chart to visually represent the intervals where the function is concave up or down by testing values in the derivative equations.
- 📌 Inflection points often occur between relative extrema of a function, such as between a maximum and a minimum.
- 💡 When the second derivative changes sign, this indicates an inflection point; without a change in sign, there is no inflection point.
- 🔎 To find the exact coordinates of an inflection point, substitute the x-value that makes the second derivative zero back into the original function to get the corresponding y-value.
- 📈 Practice problems help solidify the understanding of inflection points and concavity by applying the concepts to specific functions and calculating their derivatives.
Q & A
What is an inflection point in a function?
-An inflection point in a function is a point where the concavity of the function changes. It occurs when the second derivative of the function is equal to zero, and the concavity switches from being negative (concave down) to positive (concave up) or vice versa.
How can you determine if a function is concave up or concave down?
-A function is concave up where its second derivative is positive, indicating that the first derivative is increasing. Conversely, a function is concave down when its second derivative is negative, meaning the first derivative is decreasing.
What is the significance of the second derivative in determining concavity?
-The second derivative is crucial in determining the concavity of a function. A positive second derivative indicates that the function is concave up, while a negative second derivative indicates that the function is concave down.
What are the necessary conditions for a point to be an inflection point?
-For a point to be an inflection point, the second derivative must be equal to zero, and there must be a change in concavity—either from positive to negative or from negative to positive.
How do you find the inflection points of a function?
-To find the inflection points of a function, first, find the first and second derivatives of the function. Then, set the second derivative equal to zero and solve for the variable to find the potential inflection points. These points must also have a change in concavity to be considered true inflection points.
What happens at the inflection points in terms of the function's behavior?
-At inflection points, the function's behavior changes in terms of its concavity. It transitions from concave up to concave down or from concave down to concave up at these points.
How can you use a sign chart to determine concavity?
-A sign chart can be used to determine the intervals where the function is concave up or concave down. By testing values in the intervals formed by the potential inflection points and evaluating the sign of the second derivative, you can determine the concavity on each interval.
What is the relationship between inflection points and relative extrema?
-Inflection points often occur between relative extrema of a function. There is typically an inflection point between a local maximum and a local minimum, indicating a change in the function's concavity and overall behavior.
How do you find the y-coordinate of an inflection point?
-To find the y-coordinate of an inflection point, substitute the x-coordinate of the inflection point back into the original function and calculate the resulting value.
What is the role of the first derivative in determining concavity?
-While the first derivative indicates the slope of the function, it is the second derivative that directly informs us about the concavity. A positive first derivative does not necessarily mean the function is concave up, and a negative first derivative does not necessarily mean the function is concave down. It is the second derivative that confirms the concavity.
Can a function have more than one inflection point?
-Yes, a function can have more than one inflection point. Each inflection point represents a change in concavity, and complex functions can exhibit multiple changes in concavity across their domain.
Outlines
📈 Introduction to Inflection Points and Concavity
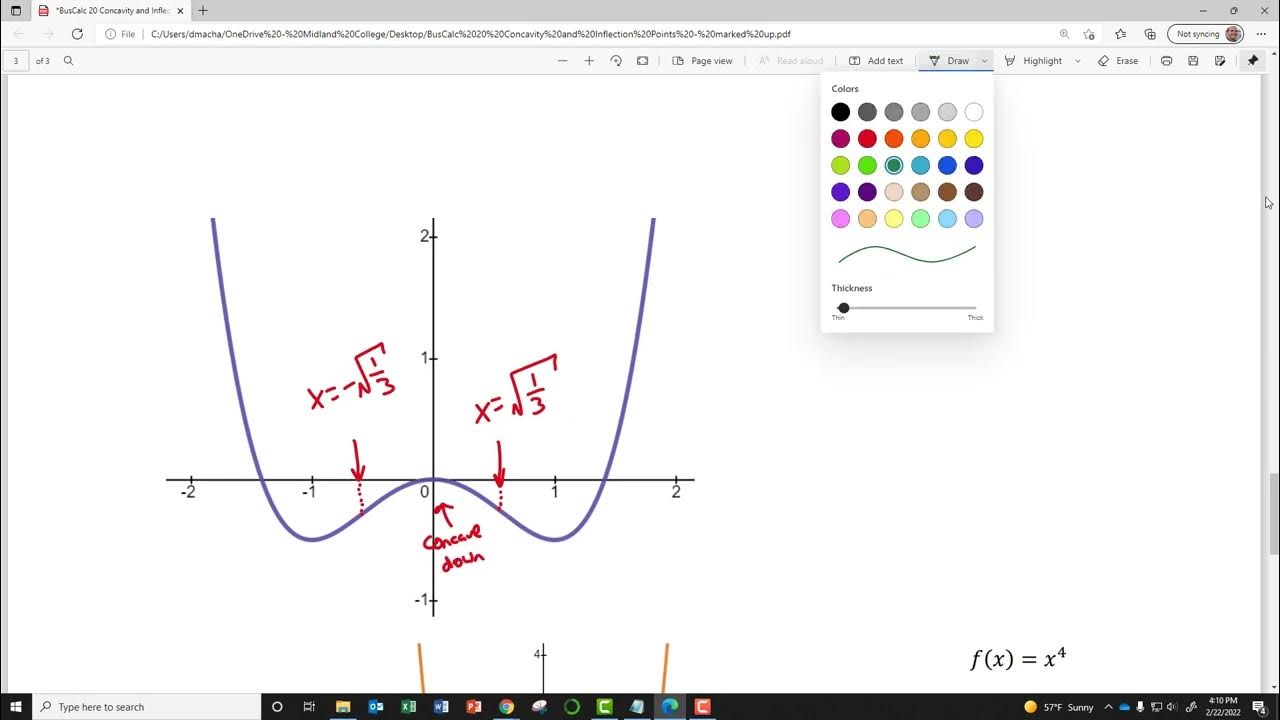
This paragraph introduces the concept of inflection points and concavity in the context of mathematical functions. It explains that inflection points are the points where the concavity of a function changes, either from concave up to concave down or vice versa. The paragraph also describes how the second derivative of a function can be used to identify these points, with a positive second derivative indicating concave up regions and a negative second derivative indicating concave down regions. The explanation is accompanied by visual descriptions of graphs to aid understanding.
🧠 Determining Inflection Points and Concave Intervals
The second paragraph delves into the process of determining inflection points and the intervals where a function is concave up or concave down. It provides a step-by-step guide on how to find the second derivative of a function and use it to locate inflection points by setting the second derivative equal to zero. The paragraph also includes the creation of a sign chart to visualize the changes in concavity and the identification of the intervals. A specific example is worked out, demonstrating the calculation of inflection points and the concave intervals for a given function.
🔢 Solving for Inflection Points and Concave/Convex Analysis
The final paragraph continues with the theme of inflection points and concavity, presenting another example problem. It guides the viewer through finding the first and second derivatives of a new function and using these to identify inflection points and concave intervals. The paragraph emphasizes the importance of the concavity changing at inflection points and provides a method for finding the y-coordinates of these points. The summary concludes with a reiteration of the key concepts and a reminder that the concavity must change at an inflection point for it to be valid.
Mindmap
Keywords
💡concavity
💡second derivative
💡inflection point
💡first derivative
💡relative extrema
💡sign chart
💡ordered pair
💡power rule
💡interval notation
💡practice problems
Highlights
The video discusses how to determine the inflection points of a function and the intervals where the function is concave up and concave down.
Concavity is a key concept in understanding the shape of a graph, with concave up indicated by a positive second derivative and concave down by a negative second derivative.
An inflection point occurs when the second derivative is equal to zero and there is a change in concavity, either from negative to positive or positive to negative.
The inflection point is typically situated between two relative extrema, which can be a maximum and a minimum.
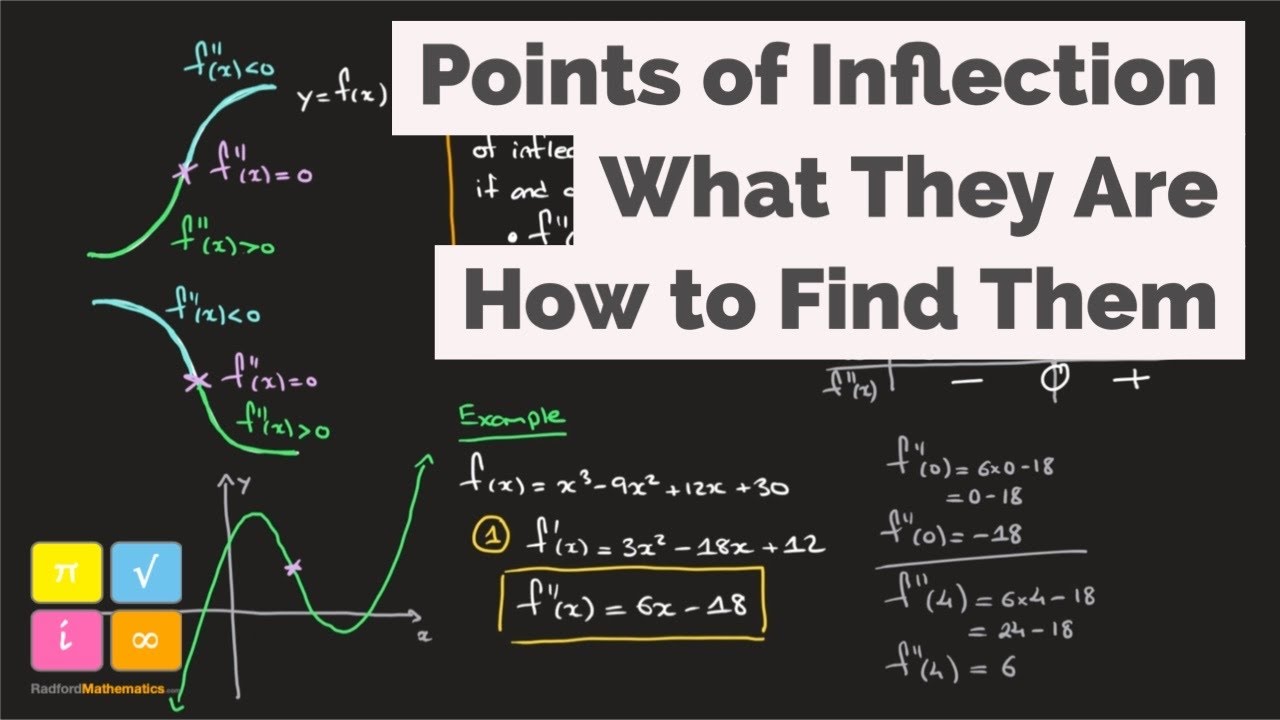
The first example provided involves a function f(x) = x^3 - 9x^2 + 7x, where the concavity changes at x=3, indicating an inflection point.
The second derivative of the function in the first example is 6x - 18, and setting this equal to zero helps identify the inflection point at x=3.
The function in the first example is concave down from negative infinity to 3 and concave up from 3 to positive infinity.
The inflection point at x=3 can be expressed as an ordered pair (3, -33) by plugging the x-value back into the original function.
The second example involves a function f(x) = x^4 + 4x^3 + 1, with inflection points identified at x=0 and x=-2 through a similar process.
The second derivative of the second example is 12x^2 + 24x, and setting factors equal to zero yields potential inflection points at x=0 and x=-2.
A sign chart is used to determine the intervals of concavity for the second example, with concave up intervals between negative infinity and -2, and from 0 to positive infinity.
The inflection points for the second example are at (0, 1) and (-2, -15), as determined by plugging the x-values back into the original function.
The importance of the concavity changing across an inflection point is emphasized, as a point is only considered an inflection point if there is a change in concavity.
The video provides a clear methodology for determining inflection points and intervals of concavity, which is crucial for understanding the behavior of mathematical functions.
The practical applications of understanding inflection points and concavity include predicting the behavior of real-world phenomena modeled by mathematical functions.
The video's approach to teaching the concept of inflection points and concavity is through step-by-step problem-solving and clear explanations.
The process of identifying inflection points and concavity intervals involves finding derivatives, setting them equal to zero, and using sign charts to visualize the function's behavior.
The video emphasizes the importance of understanding the relationship between the first and second derivatives and the concavity of a function.
Transcripts
Browse More Related Video
BusCalc 20 Concavity and Inflection Points

MATH1325 Lecture 10 2 - Concavity & Points of Inflection

Learn how to find the points of inflection for an equation

Business Calculus - Math 1329 - Section 3.2 - Concavity and Points of Inflection
Point of Inflection - Point of Inflexion - f''(x)=0 - Definition - How to Find - Worked Example 1

Inflection Point Grade 12
5.0 / 5 (0 votes)
Thanks for rating: