Symbols in statistics. Sample or Population?
TLDRThis video discusses the fundamental concepts of statistics, focusing on the distinction between sample and population data. It explains the use of symbols like lowercase 'n' for sample size and uppercase 'N' for population size, as well as 'x̄' for sample mean and 'μ' for population mean. Additionally, it highlights the notation for standard deviation, 's' for sample and 'σ' for population, emphasizing that uppercase and Greek letters often represent population parameters.
Takeaways
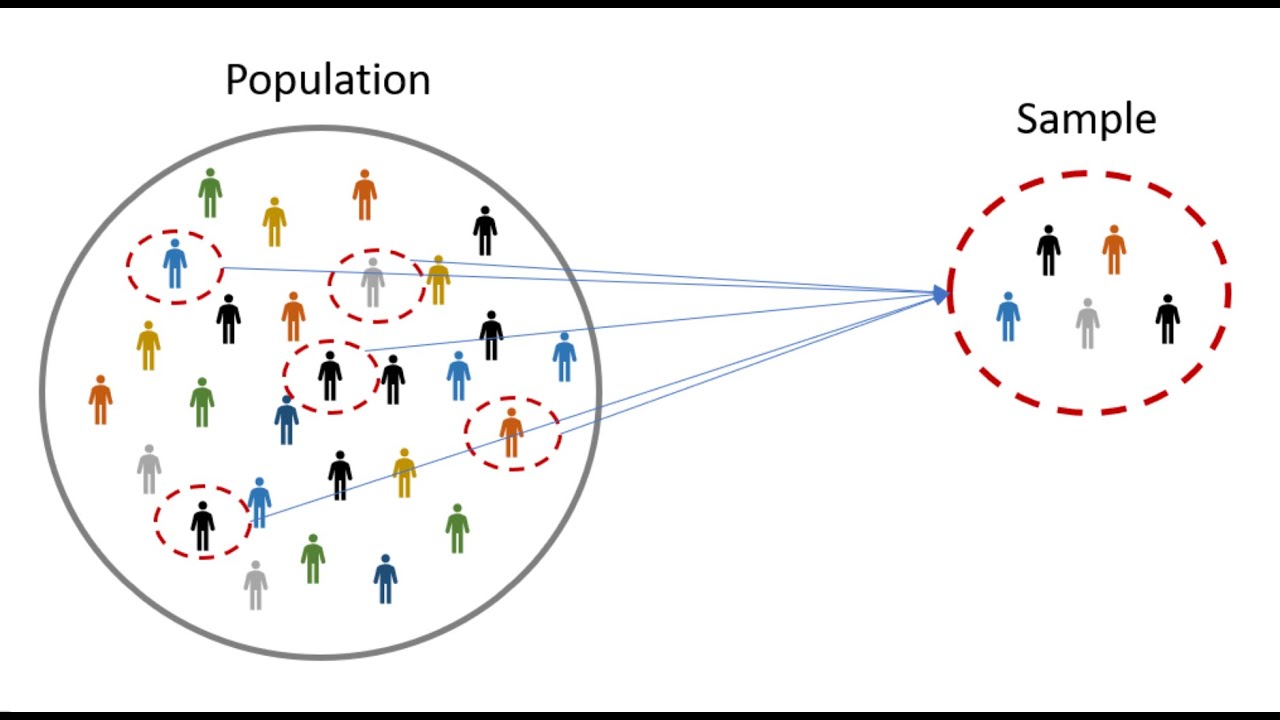
- 📊 The difference between a sample and a population is fundamental in statistics. A sample is a subset of the population and does not include all data, while a population encompasses all relevant data.
- 🔍 A sample is often used when it's impractical to study an entire population, such as interviewing a portion of attendees at a concert rather than all 20,000 people.
- 🌐 The term 'population' refers to the entire group of interest, which can be all people living in a certain area, attending a specific institution, or belonging to a particular community.
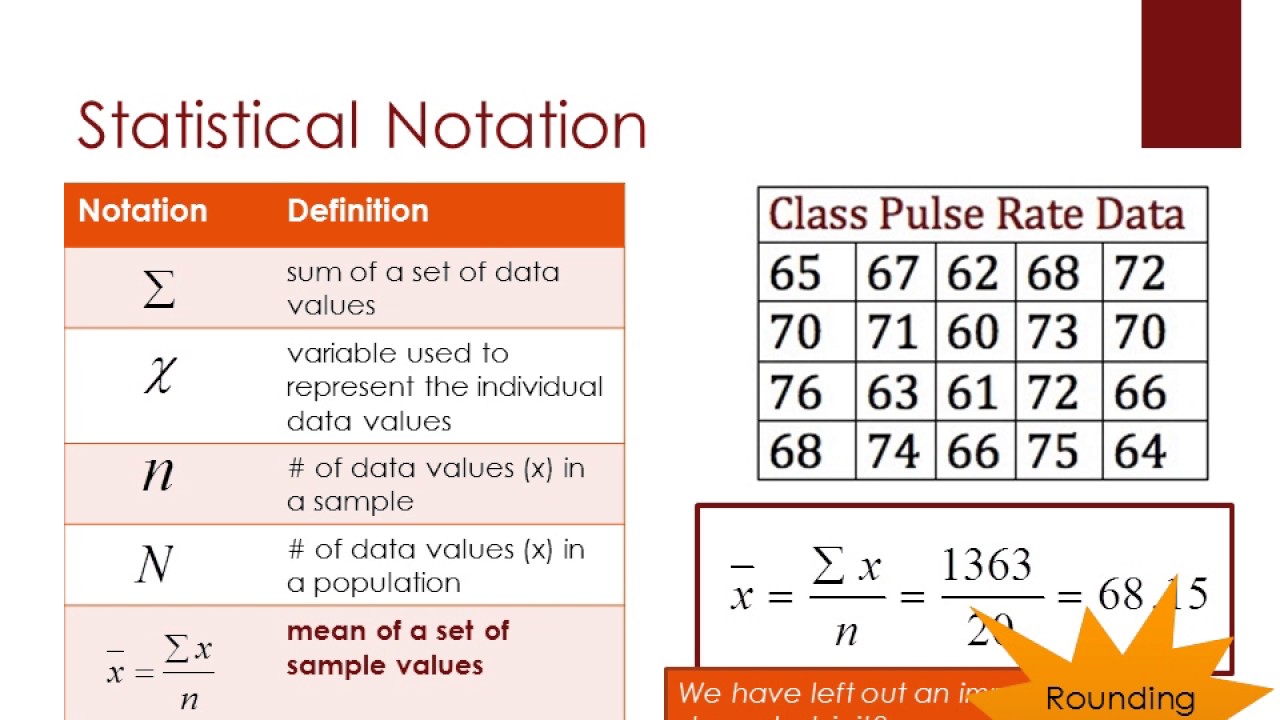
- 🔢 The symbol 'n' is used to denote sample size, while 'N' is used for the size of the entire population. Lowercase 'n' indicates a sample, and uppercase 'N' indicates a population.
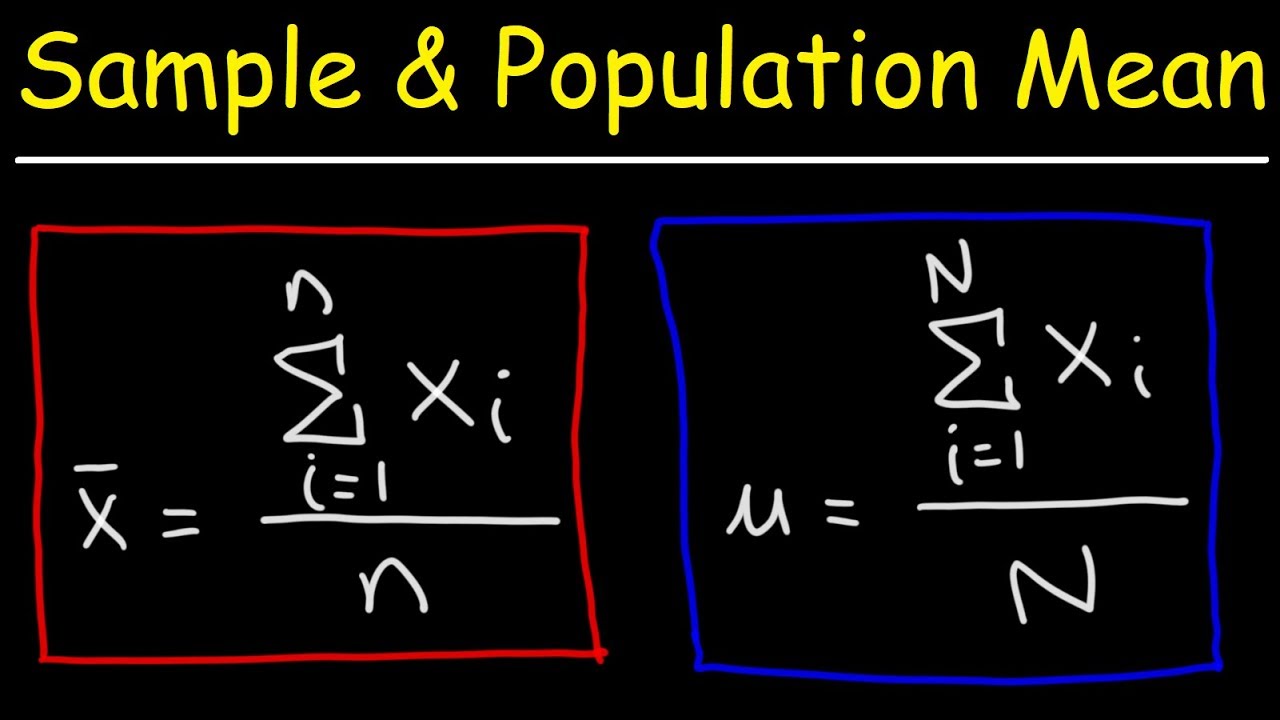
- 📈 The mean of a sample is represented by 'x̄' (x-bar), whereas the mean of a population is denoted by 'μ' (mu). These symbols are crucial for understanding the average values from different data sets.
- 📉 Standard deviation is indicated by 's' for a sample and 'σ' (sigma) for a population. Both symbols represent variability within the data, but 's' is specific to samples, and 'σ' is for populations.
- 📚 When reading statistical materials, the use of lowercase or uppercase letters, or Greek letters, can indicate whether the data is from a sample or a population.
- 🔎 It is generally easier to obtain data from a sample than from an entire population, which is why symbols like 'x̄' are more commonly encountered in statistical analysis.
- 📉 The use of English letters for samples and Greek letters or uppercase letters for populations is a convention that helps distinguish between the two in statistical notation.
- 💡 Understanding the distinction between samples and populations is crucial for making accurate inferences and generalizations in statistical analysis.
Q & A
What is the primary difference between a sample and a population in the context of statistics?
-A sample refers to a subset of a larger group or population, while a population includes all members of the group being studied. For example, if you have 20,000 people at a concert, a sample might be 500 or 10,000 people interviewed, whereas the population would be all 20,000 people.
Why is it often more challenging to gather information from a population rather than a sample?
-Gathering information from a population is more challenging because it requires collecting data from every member of the group, which can be time-consuming and resource-intensive. In contrast, a sample is a smaller, more manageable subset of the population.
What does the symbol 'n' represent in statistics, and how does its case (lowercase or uppercase) indicate the type of data being referred to?
-The symbol 'n' represents the size of a sample or population. Lowercase 'n' indicates the size of a sample, while uppercase 'N' indicates the size of the entire population.
What is the difference between the symbols 'x̄' (x bar) and 'μ' (mu) in statistical notation?
-Both symbols represent the mean, but 'x̄' (x bar) is used for the sample mean, while 'μ' (mu) is used for the population mean. 'x̄' is more commonly used because it's easier to obtain a sample than the entire population.
How do the symbols 's' and 'σ' (sigma) differ in their representation of standard deviation in statistics?
-Both 's' and 'σ' represent standard deviation, but 's' is used for the sample standard deviation, and 'σ' is used for the population standard deviation.
Why might uppercase letters and Greek letters be used to represent population parameters in statistics?
-Uppercase letters and Greek letters are often used to represent population parameters because they help distinguish them from sample parameters, which are typically represented by lowercase letters from the English alphabet.
What is the significance of using different symbols for sample and population parameters in statistical analysis?
-Using different symbols helps clearly distinguish between sample and population data, which is crucial for accurate statistical analysis and interpretation. It prevents confusion and ensures that the data being analyzed is correctly identified as either a sample or the entire population.
Can you provide an example of how a sample might be selected from a larger population?
-An example could be selecting 500 people from a concert of 20,000 attendees to gather data on their preferences or behaviors. This smaller group of 500 represents a sample of the larger population.
What are some potential limitations of relying on sample data instead of population data in statistical analysis?
-Relying on sample data can introduce sampling bias and may not accurately represent the entire population. This can lead to skewed results and conclusions that may not be generalizable to the whole population.
How can a researcher ensure that a sample is representative of the population in a study?
-A researcher can ensure representativeness by using random sampling techniques, stratified sampling, or other methods that aim to capture the diversity and characteristics of the population within the sample.
Outlines
📊 Understanding Samples and Populations in Statistics
This paragraph introduces the fundamental concepts of statistics, focusing on the distinction between samples and populations. A sample is a subset of a larger group, such as interviewing a portion of the 20,000 people at a concert. In contrast, a population encompasses all individuals in a group, requiring data from every member, like interviewing all 20,000 concert attendees. The paragraph emphasizes the importance of having access to a population for better data, though it acknowledges the difficulty in achieving this. Symbols for sample size (lowercase 'n') and population size (uppercase 'N') are introduced, along with their implications in statistical analysis.
🔢 Symbols for Mean and Standard Deviation in Statistics
This paragraph delves deeper into statistical symbols, specifically those representing mean and standard deviation. It explains that the sample mean is denoted by 'x bar', while the population mean is represented by 'mu'. Similarly, the sample standard deviation is indicated by 's', and the population standard deviation is denoted by 'sigma'. The paragraph highlights the convention of using lowercase and uppercase letters to distinguish between samples and populations. It also notes that Greek letters and uppercase letters are often used to represent population parameters, providing a clear guideline for understanding statistical notation.
Mindmap
Keywords
💡Sample
💡Population
💡Lowercase n (n)
💡Uppercase N (N)
💡X bar (x̄)
💡Mu (μ)
💡S (Standard Deviation)
💡Sigma (σ)
💡Mean
💡Standard Deviation
Highlights
Introduction to basic types of statistics and symbols used in statistics.
Difference between information given about a sample and a population.
A sample is a subset of the data, not the entire dataset.
An example of a sample is interviewing a portion of 20,000 concert attendees.
A population refers to all data points, such as interviewing all 20,000 concert attendees.
The difficulty in obtaining complete population data.
Better data quality is obtained from a population compared to a sample.
Symbols used to compare samples to populations: lowercase 'n' for sample size, uppercase 'N' for population size.
Lowercase 'n' indicates a sample, uppercase 'N' indicates the entire population.
Differences in notation for sample mean (x bar) and population mean (mu).
Sample mean is more commonly encountered due to the ease of obtaining sample data.
Notation for standard deviation: 's' for sample standard deviation, 'sigma' for population standard deviation.
Use of uppercase letters and Greek letters to represent population data.
Use of English letters to represent sample data.
The distinction between symbols based on whether they come from a sample or a population.
Greek letters and uppercase letters often indicate population data.
Transcripts
Browse More Related Video
Statistical Notation
Statistics: Populations & Samples and Parameters vs Statistics

Symbols commonly used in statistics
Sample Mean and Population Mean - Statistics
Calculating the Mean, Variance and Standard Deviation, Clearly Explained!!!

Inferring population mean from sample mean | Probability and Statistics | Khan Academy
5.0 / 5 (0 votes)
Thanks for rating: