What is a Bell Curve or Normal Curve Explained?
TLDRThe video explains the bell curve, or normal curve, a statistical tool often used in psychology to analyze data distributions. Key characteristics include the mean at the center, a single peak (unimodal), and predictable standard deviations. In a normal distribution, 68% of scores fall within one standard deviation, 95% within two, and 99.7% within three. The curve is symmetrical and commonly used in IQ testing, with most scores falling within one to two standard deviations. Periodic restandardization accounts for phenomena like the Flynn effect to maintain accurate distributions.
Takeaways
- 📊 A bell curve, also known as a normal curve, is a graphical representation of data distribution that forms a bell shape.
- 📈 The mean in a bell curve is always at the center, making it a central point in the distribution.
- 🔍 A bell curve has a single mode, meaning it has only one peak, which is referred to as unimodal.
- 🌐 The standard deviations in a bell curve are predictable and are key in understanding data distribution.
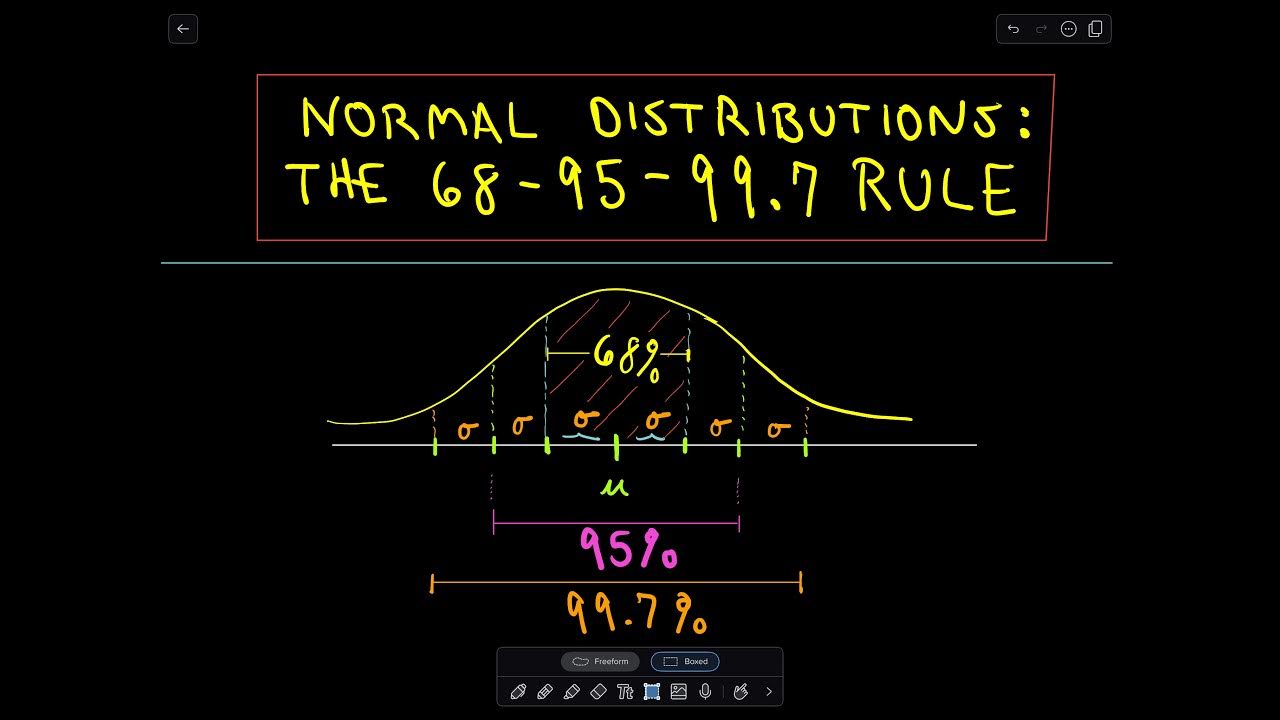
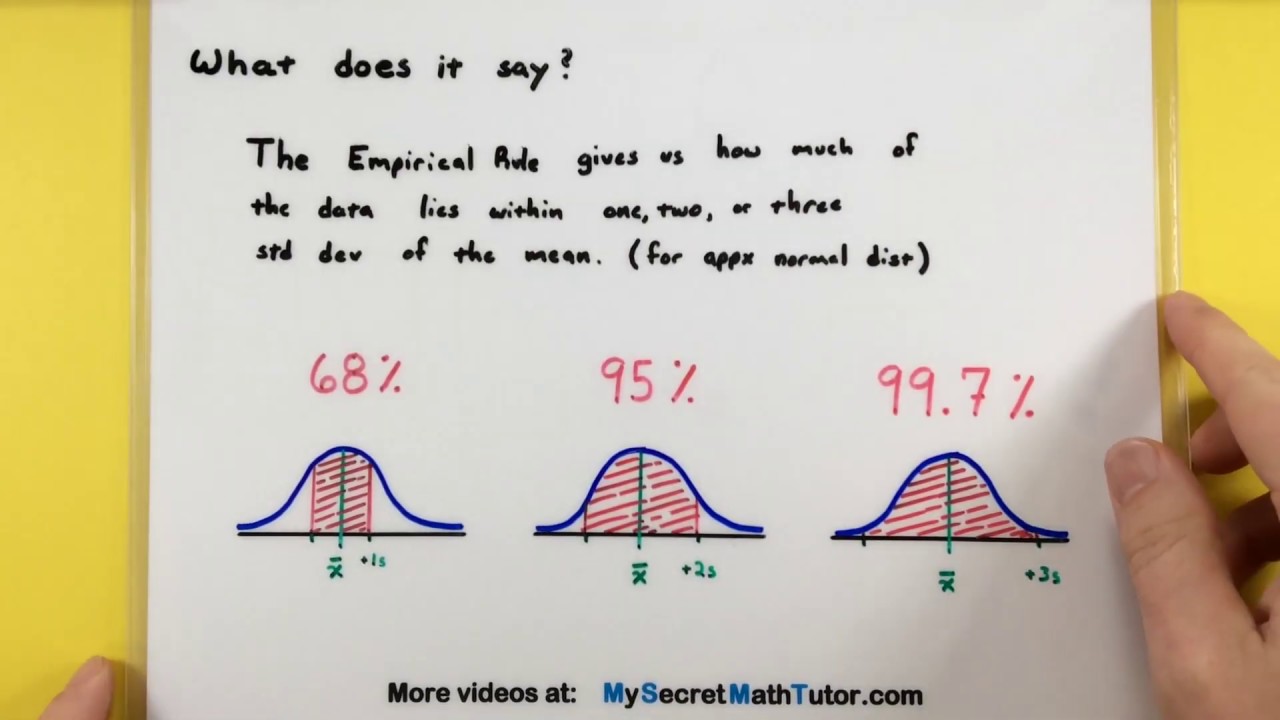
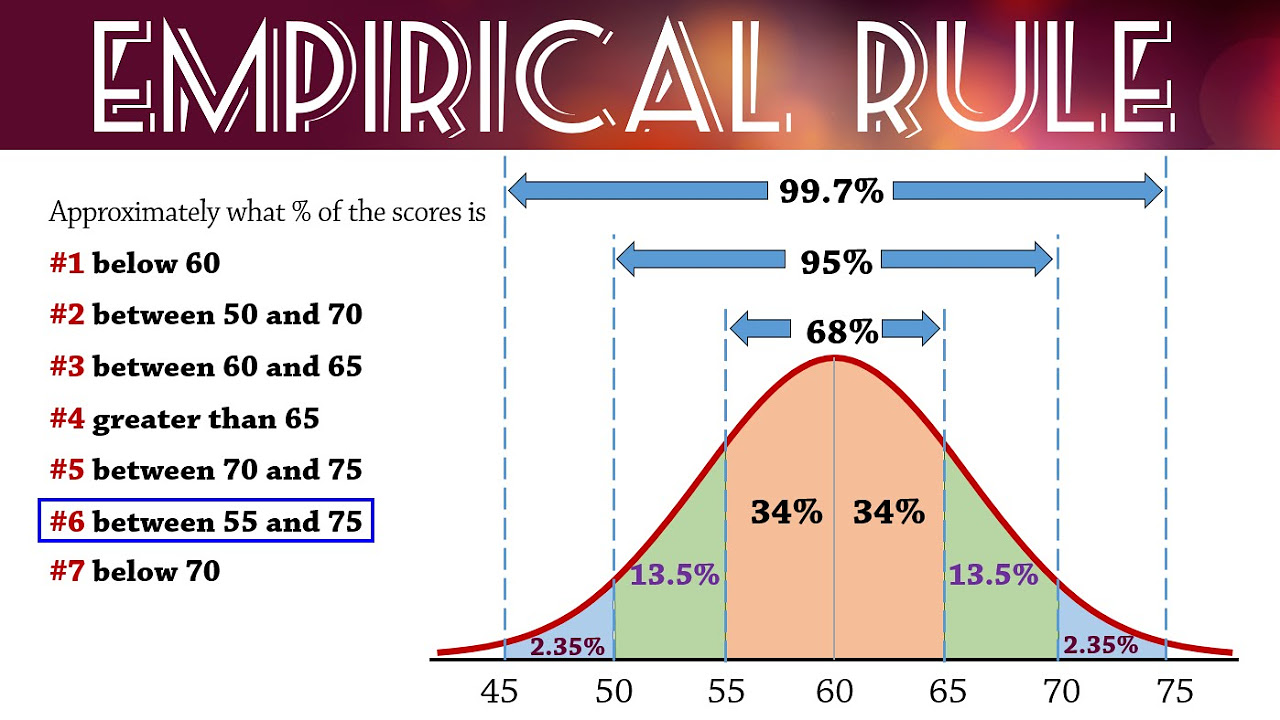
- 🔢 Approximately 68% of the data falls within one standard deviation from the mean in a normal distribution.
- 🔎 95% of the data is found within two standard deviations from the mean, indicating a broader range of data points.
- 📚 Nearly all (99.7%) of the data, specifically 99.7%, falls within three standard deviations from the mean.
- 🔴 The bell curve is symmetrical, which is a crucial characteristic in its representation of data.
- 🧠 Bell curves are often used in IQ testing to illustrate the distribution of intelligence scores.
- 📉 Most IQ scores fall between one and two standard deviations from the mean, with outliers being less common.
- 🔄 Intelligence tests are periodically re-standardized to account for changes in population intelligence, such as the Flynn effect.
Q & A
What is a bell curve or normal curve?
-A bell curve or normal curve describes the distribution of a set of data that creates a bell shape. It is commonly used in statistics and psychology to examine data sets.
What is a probability distribution?
-A probability distribution is a function that describes the likelihood of different outcomes in a random experiment. The bell curve is one type of probability distribution.
Where is the mean located in a bell curve?
-In a bell curve, the mean is always at the center of the distribution.
What does it mean for a bell curve to be unimodal?
-A bell curve is unimodal because it has only one peak or mode. In contrast, bimodal distributions have two peaks.
What are standard deviations in the context of a bell curve?
-Standard deviations measure how far away data points are from the mean. In a normal bell curve, standard deviations are predictable and often fall within specific percentages of the data.
What percentage of data falls within one standard deviation of the mean in a bell curve?
-68% of the data falls within one standard deviation of the mean in a bell curve.
What percentage of data falls within two standard deviations of the mean in a bell curve?
-95% of the data falls within two standard deviations of the mean in a bell curve.
What percentage of data falls within three standard deviations of the mean in a bell curve?
-99.7% of the data falls within three standard deviations of the mean in a bell curve.
What is meant by the symmetry of a bell curve?
-The symmetry of a bell curve means that it is symmetrical around the mean, with the left and right sides mirroring each other.
How is a bell curve used in IQ testing?
-In IQ testing, a bell curve illustrates IQ scores, showing that most scores fall between one and two standard deviations from the mean. Scores beyond this range are less common.
What is the Flynn effect?
-The Flynn effect refers to the observed increase in intelligence test scores over the past several decades, necessitating periodic restandardization of intelligence tests.
Outlines
📊 Understanding the Bell Curve
The bell curve, also known as the normal curve, is a statistical tool used to describe the distribution of data points. It forms a bell-shaped graph with the mean at the center. This curve is characterized by a single peak, indicating a unimodal distribution. The standard deviations from the mean are predictable, with 68% of the data falling within one standard deviation, 95% within two, and 99.7% within three. This curve is symmetrical, meaning the data distribution is mirrored around the mean. It is commonly used in IQ testing to illustrate the distribution of intelligence scores, with most scores falling between one and two standard deviations from the mean. Periodic restandardization of intelligence tests is necessary to account for phenomena like the Flynn effect, which has led to an increase in intelligence scores over time.
Mindmap
Keywords
💡Bell Curve
💡Normal Curve
💡Mean
💡Mode
💡Standard Deviation
💡68-95-99.7 Rule
💡Symmetry
💡IQ Testing
💡Flynn Effect
💡Restandardization
💡Distribution
Highlights
A bell curve or normal curve describes the distribution of data that creates a bell shape.
It is commonly used in statistics and psychology to examine gathered data.
The bell curve is a probability distribution with specific characteristics.
The mean in a bell curve is always at the center.
The bell curve has a single mode, making it unimodal.
Predictable standard deviations are a key feature of the bell curve.
68% of the data falls within one standard deviation from the mean.
95% of the data falls within two standard deviations from the mean.
99.7% of the data falls within three standard deviations from the mean.
The bell curve can be applied to various measurements such as heights, weights, and aptitudes.
The bell curve is symmetrical in shape.
Bell curves are often used in IQ testing to illustrate IQ scores.
Most IQ scores fall between one and two standard deviations from the mean.
Intelligence tests are periodically re-standardized to account for the Flynn effect.
The Flynn effect refers to the increase in intelligence over the past several years.
Re-standardization of intelligence tests helps maintain a consistent distribution.
Transcripts
Browse More Related Video

Elementary Statistics - Chapter 6 Normal Probability Distributions Part 1
The Normal Distribution and the 68-95-99.7 Rule

Empirical Rule of Standard Deviation in Statistics

Normal Distribution & Probability Problems
Statistics - How to use the Empirical Rule
Empirical Rule (68-95-99.7) for Normal Distributions
5.0 / 5 (0 votes)
Thanks for rating: