Statistics: Sample vs. Population Mean
TLDRThe video script discusses the concept of mean in statistics, differentiating between sample and population means. It explains the impracticality of measuring every individual in a large population, such as all men in America, and suggests using a random sample to estimate the population mean. The script introduces statistical notation, with mu (μ) representing the population mean and an x-bar representing the sample mean. It emphasizes the importance of understanding these concepts to avoid confusion in statistical analysis.
Takeaways
- 📈 The concept of measures of dispersion was mentioned as a topic for a future discussion.
- 🔄 The speaker realized there was more to discuss about the mean before moving on.
- 🔍 A distinction was made between a sample and a population, using the example of average height of men in America.
- 🌐 The impracticality of measuring every individual in a large population was highlighted.
- 🎯 The notion of using a sample to estimate population parameters was introduced.
- 🔨 The importance of random sampling to avoid bias was emphasized.
- 📊 The calculation of the sample mean was explained with a hypothetical example.
- 🪐 The symbols μ (mu) for population mean and 𝑥̅ (x-bar) for sample mean were introduced.
- 📝 The formula for calculating the sample mean was presented in statistical notation.
- 📈 The formula for the population mean was also explained, using similar notation to the sample mean.
- 🤔 The potential confusion between sample and population means was acknowledged and clarified.
Q & A
What is the main topic discussed in the video script?
-The main topic discussed in the video script is the concept of measures of dispersion and the difference between a sample and a population, specifically in the context of calculating the mean.
Why is it impractical to measure the average height of all men in America?
-It is impractical because the population is vast, with 150 million men, and the constant changes in the population due to births and deaths make it nearly impossible to obtain an accurate measurement of the average height of every individual.
What is the best alternative to measure the average height of the entire population when it's too large to measure directly?
-The best alternative is to take a random sample from the population and calculate the mean of that sample, which is known as the sample mean.
How can one avoid bias when selecting a sample?
-One can avoid bias by selecting a random and representative sample, ensuring that the sample is not skewed based on any particular characteristic, such as height in this case.
What are the notations used in statistics to represent the population mean and the sample mean?
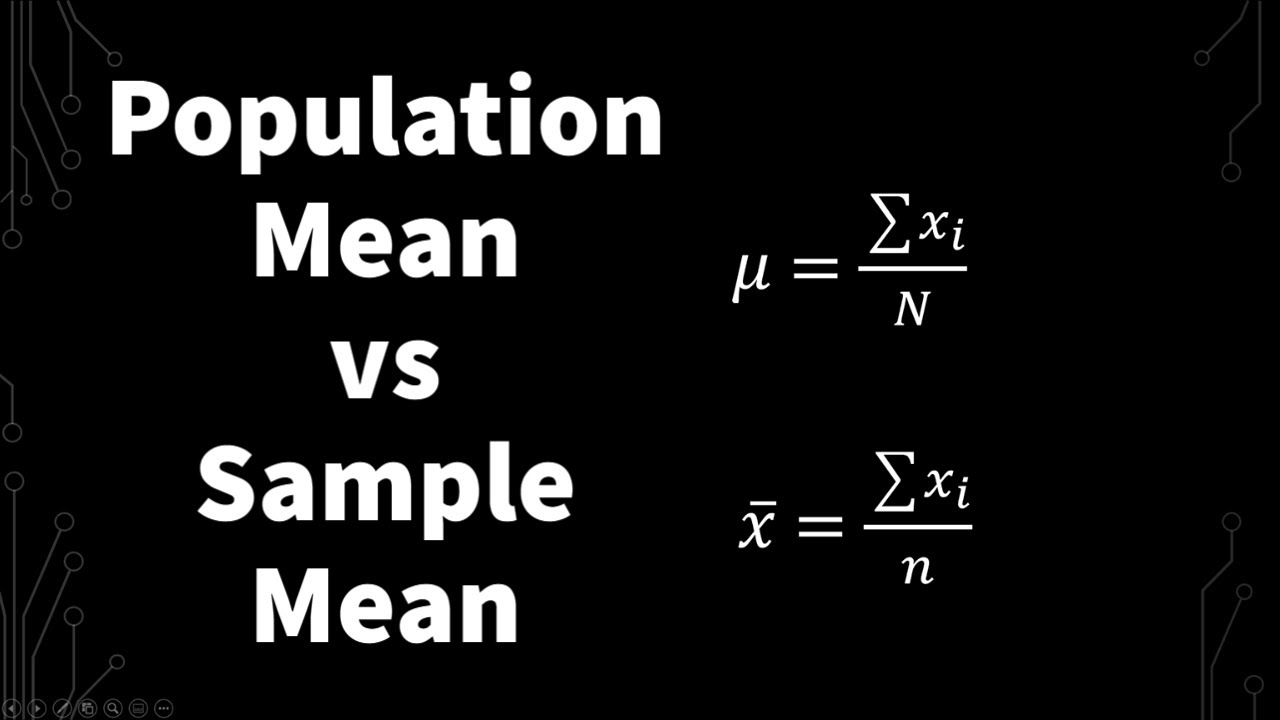
-The population mean is represented by the Greek letter mu (μ), while the sample mean is represented by 'x' with a line over it (ȳ).
How is the sample mean calculated?
-The sample mean is calculated by adding up all the individual measurements in the sample and then dividing by the number of measurements in the sample.
What is the formula for calculating the population mean?
-The population mean is calculated using the formula: (Σx_i) / N, where the sum (Σ) of each data point (x_i) is taken from n=1 to the entire population size (N).
How does the notation for the sample mean differ from that of the population mean?
-The notation for the sample mean uses 'x' with a subscript (x_i) for each member of the sample and a sum (Σ) over all members, while the population mean uses 'x' with a subscript (x_i) but with a big N (N) to represent the entire population.
What is the significance of the notation with a line over the 'x' in the sample mean?
-The line over the 'x' in the sample mean (ȳ) signifies that it is an average of a subset of the data, specifically the sample, rather than the entire population.
How does the video script emphasize the importance of understanding the difference between population and sample mean?
-The video script emphasizes that understanding the difference between population and sample mean is crucial for avoiding confusion later on in statistical analysis, as the concepts and formulas may appear similar but refer to different sets of data.
What is the role of random sampling in statistics?
-Random sampling plays a critical role in statistics as it helps to obtain a representative subset of the population for analysis. This ensures that the results derived from the sample can be generalized to the larger population with a degree of accuracy and reliability.
Outlines
📊 Introduction to Measures of Dispersion and Mean
This paragraph introduces the topic of measures of dispersion, which was initially planned to be discussed in the previous video. However, the speaker shifts focus to elaborate on the concept of the mean, specifically differentiating between a sample and a population. The speaker uses the example of calculating the average height of all men in America to illustrate the impracticality of measuring every individual in a large population. Instead, the speaker explains the concept of a sample mean, which is a more feasible approach to estimate the population mean. The paragraph also introduces statistical notations for the population mean (μ) and sample mean (x̄), emphasizing the importance of understanding these distinctions early on to avoid confusion later in statistical studies.
📈 Calculation and Notation of Means
In this paragraph, the speaker delves deeper into the calculation and notation of means, both for populations and samples. The speaker clarifies that while the concepts of population and sample mean are fundamentally similar, they are represented with different notations in statistical texts. The paragraph provides a step-by-step explanation of how to calculate the sample mean using a summation notation (Σx_i) and how to express it as a formula (x̄ = Σx_i / n). Similarly, the population mean is calculated by summing all data points in the population and dividing by the total number of data points (μ = Σx_i / N). The speaker emphasizes that despite the seemingly complex notation, the process of calculating means is straightforward and involves simply adding up all data points and dividing by the number of points. The paragraph concludes by reinforcing the importance of understanding the difference between population and sample means to avoid confusion in statistical analysis.
Mindmap
Keywords
💡dispersion
💡mean
💡sample
💡population
💡arithmetic mean
💡notation
💡random sample
💡skew
💡sum
💡data point
💡population mean
Highlights
The discussion on measures of dispersion and distribution of data sets.
Differentiation between a sample and a population, with an example of measuring the average height of all men in America.
Challenges in measuring the average height of every individual in a large population, such as the men in America.
The impracticality of measuring the entire population due to factors like birth and death rates.
Introduction to the concept of using a sample to estimate the average of a population.
The importance of selecting a random and representative sample to avoid bias.
Explanation of how to calculate the mean (average) of a set of data, both for a sample and a population.
Use of statistical notation to represent the population mean (μ) and sample mean (x̄).
Clarification on the calculation formulas for the population mean (Σx_i/N) and sample mean (Σx_i/n).
The significance of understanding the difference between population and sample mean early in statistical studies.
The potential confusion that can arise from different notations used for population and sample means.
The practical application of taking a sample mean as a proxy for the population mean in large populations.
The concept of random sampling and its impact on the representativeness of the sample.
The use of the capital Sigma (Σ) to denote the sum in statistical formulas.
The explanation of the notation for individual data points in a sample (x_1, x_2, ..., x_n).
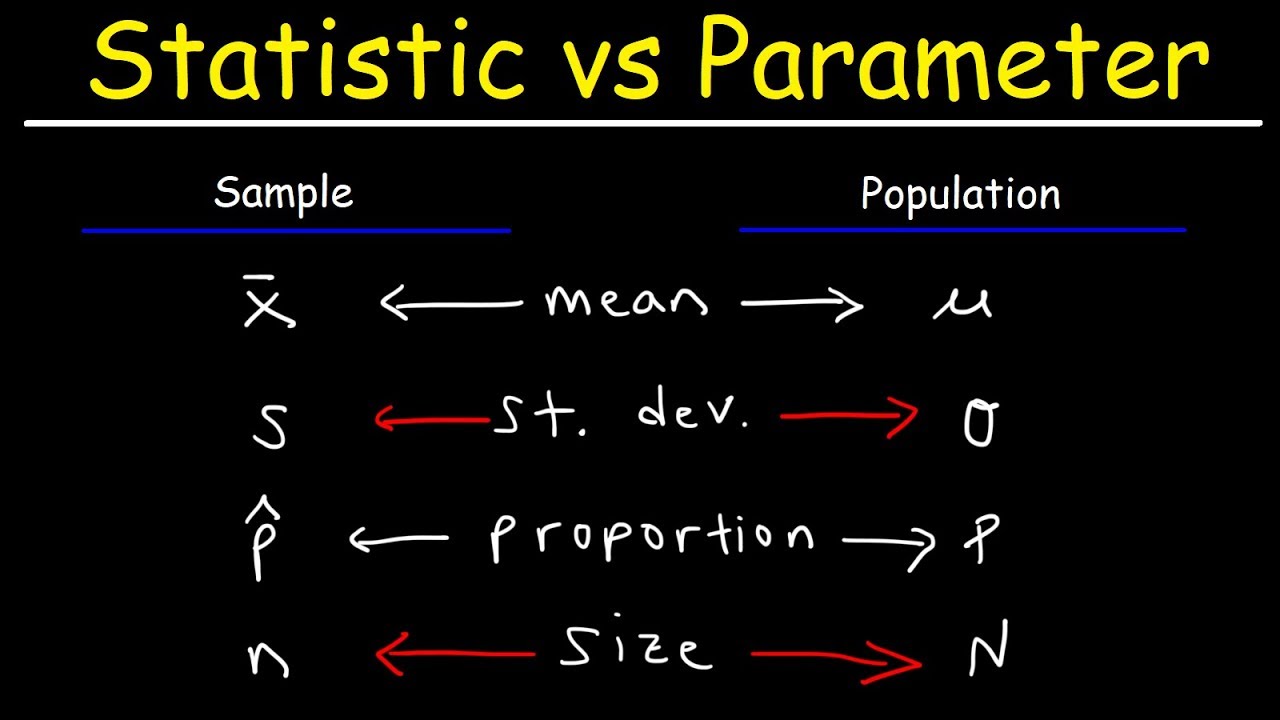
The distinction between the use of 'n' for sample size and 'N' for population size in statistical notation.
The emphasis on the importance of clear communication and understanding in statistical analysis.
Transcripts
Browse More Related Video

Inferring population mean from sample mean | Probability and Statistics | Khan Academy
Population Mean And Sample Mean (Explanation and Walkthrough Example) |Statistics

Statistical Symbols
Statistic vs Parameter & Population vs Sample
6.3.3 Sampling Distributions and Estimators - Sampling Distribution of the Sample Means
The Sampling Distribution of the Sample Mean
5.0 / 5 (0 votes)
Thanks for rating: