Inferring population mean from sample mean | Probability and Statistics | Khan Academy
TLDRThe script discusses the impracticality of measuring the exact mean height of all men in the United States due to the vast population. It suggests taking a random sample to estimate the population mean, illustrating the process with an example of five men's heights. The video explains the difference between sample statistics and population parameters, using mathematical notation to define both the sample mean (x̄) and the population mean (μ), emphasizing the importance of random sampling in statistical inference.
Takeaways
- 📏 The script discusses the process of finding the mean height of men in the United States, emphasizing the impracticality of measuring every individual.
- 🔢 It explains that the arithmetic mean is the most commonly referred 'mean' unless specified otherwise, such as the geometric mean.
- 🇺🇸 The speaker uses the example of the U.S. population to illustrate the concept, noting the vast number of men (approximately 150 million) that would need to be measured.
- ⏳ The speaker points out the dynamic nature of populations, with people being born and dying, making static data quickly outdated.
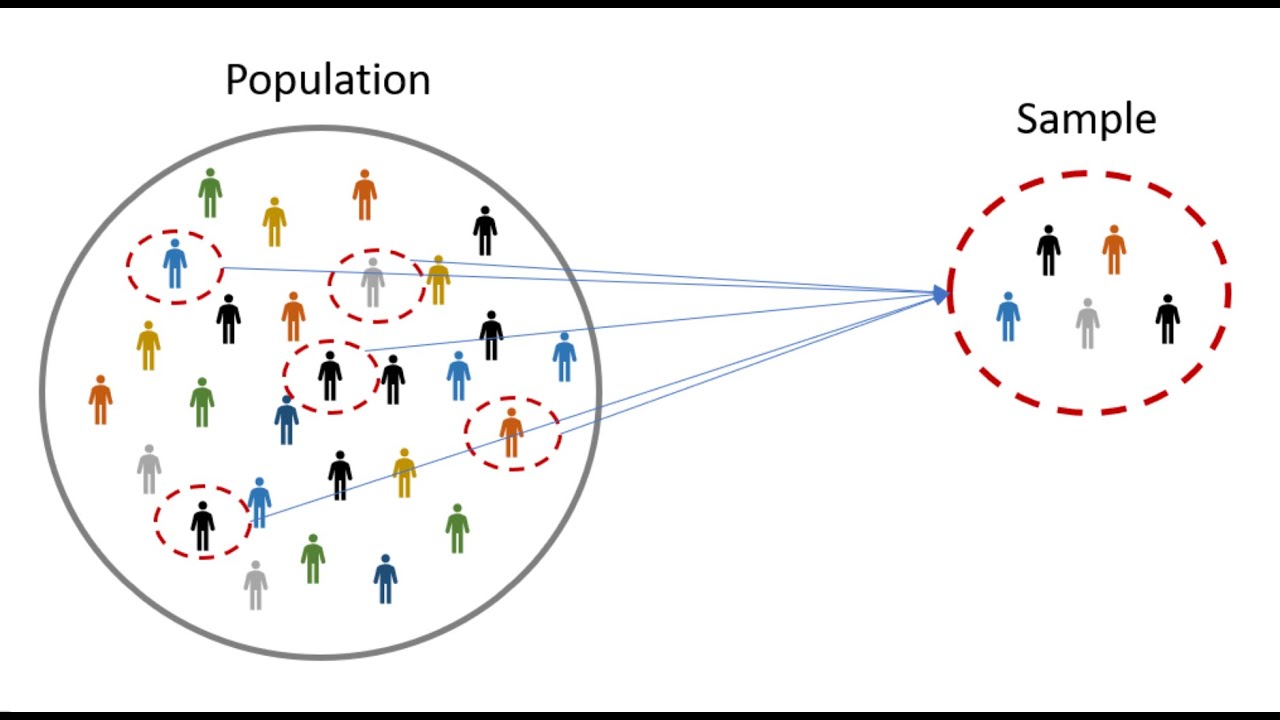
- 📉 The concept of taking a random sample to estimate the mean height is introduced as a practical alternative to measuring the entire population.
- 🎲 The importance of random sampling to avoid bias, such as not just sampling basketball players or volleyball players, is highlighted.
- 📈 The script provides a step-by-step example of calculating the mean from a sample, including the arithmetic process of adding heights and dividing by the sample size.
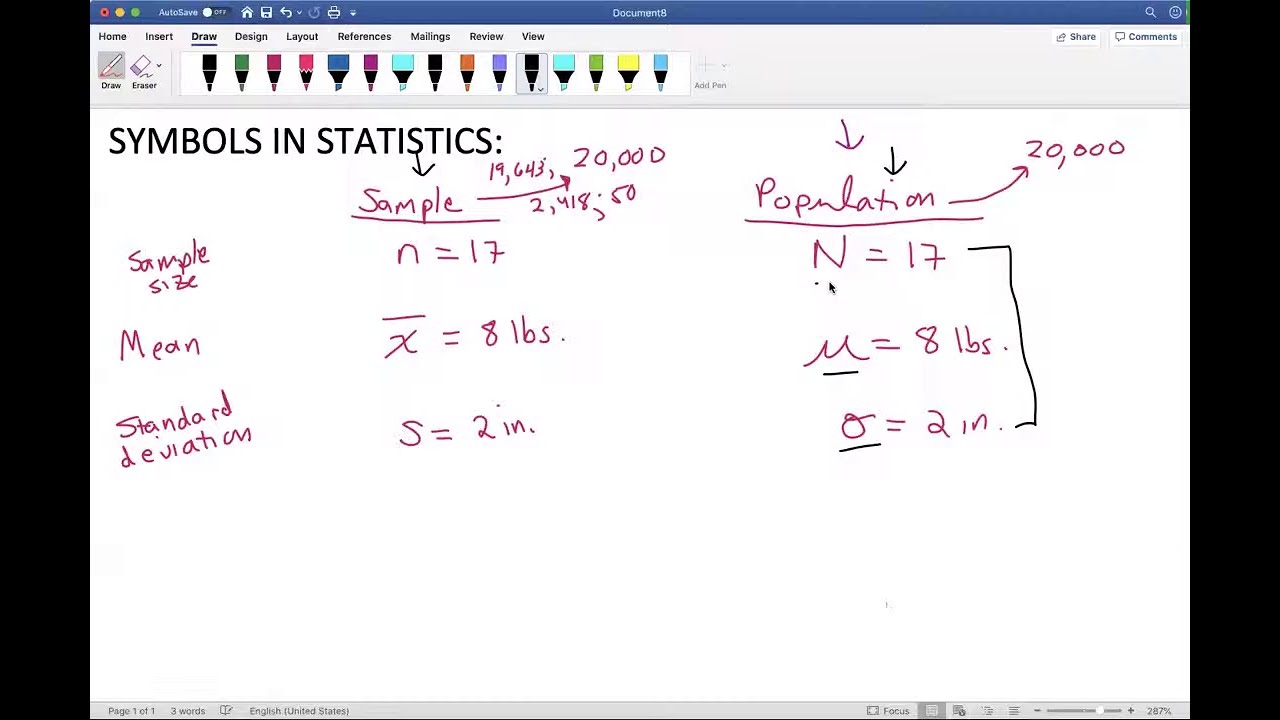
- 📊 The sample mean is represented with a bar over the variable 'x', while the population mean is denoted by the Greek letter 'mu' (μ).
- 📚 The difference between 'statistics' (sample-based calculations) and 'parameters' (true values for the entire population) is clarified.
- 📝 Mathematical notation for calculating the sample mean is explained, using summation (Σ) and subscripts to represent individual data points.
- 🔍 The script concludes by emphasizing the goal of using sample statistics to infer information about an entire population, a fundamental concept in statistics.
Q & A
What is the arithmetic mean and why is it commonly referred to as just 'mean'?
-The arithmetic mean is the sum of a set of numbers divided by the count of those numbers. It is commonly referred to as just 'mean' because it is the most frequently used measure of central tendency in statistics.
Why is it impractical to measure the height of every man in the United States to find the true mean height?
-It is impractical due to the sheer number of men in the United States, estimated at around 150 million. Additionally, the data would quickly become outdated due to births and deaths.
What is a random sample and why is it important in statistics?
-A random sample is a subset of a population in which each member has an equal chance of being selected. It is important because it helps ensure that the sample is representative of the entire population, reducing bias.
How can a sample mean be used to estimate the population mean?
-A sample mean is used to estimate the population mean by assuming that the sample is representative of the population. The larger and more random the sample, the more accurate the estimate is likely to be.
What is the difference between a statistic and a parameter in the context of statistics?
-A statistic is a quantity calculated from a sample and used to estimate a population parameter. A parameter is a quantity that describes a characteristic of the entire population.
What is the Greek letter used to denote the population mean in statistics?
-The Greek letter mu (μ) is used to denote the population mean in statistics.
How many data points would you ideally have in a sample when estimating the mean height of men in the United States?
-While the speaker suggests at least 100 or 1,000 data points for a more reliable estimate, the exact number depends on the desired level of confidence and accuracy.
What is the formula for calculating the sample mean according to the transcript?
-The formula for calculating the sample mean is the sum of all individual heights (x1, x2, ..., xn) divided by the number of data points (n), represented as \( \bar{x} = \frac{\sum_{i=1}^{n} x_i}{n} \).
What is the sum of the heights in the example given in the transcript?
-The sum of the heights in the example is 29.65 feet.
What is the sample mean height calculated in the example, and how is it denoted?
-The sample mean height calculated in the example is 5.93 feet, and it is denoted with an x-bar (x̄).
What does the capital Greek letter sigma (Σ) represent in mathematical notation?
-The capital Greek letter sigma (Σ) represents the summation operation, used to denote the sum of a sequence of terms.
Outlines
📏 Estimating the Mean Height of Men in the U.S.
This paragraph discusses the challenge of determining the mean height of men in the United States. It explains that measuring every man's height is impractical due to the large population and the dynamic nature of demographics. Instead, the speaker suggests using a random sample to estimate the mean height. The process involves calculating the arithmetic mean of the sampled heights and using this statistic as an estimate for the entire male population's mean height. The importance of randomness in sampling to avoid bias is emphasized, and a hypothetical example with five men's heights is used to demonstrate the calculation of a sample mean.
🔢 Understanding Sample and Population Means in Statistics
The second paragraph delves into the statistical concepts of sample and population means. It introduces the Greek letter mu (μ) as the notation for the population mean, which is often unattainable to measure directly for an entire population. The paragraph explains that statisticians use sample means to estimate population parameters. It also covers the mathematical notation for calculating both sample and population means, using summation (Σ) to add up all individual measurements (x_i for the sample and X_i for the population) and dividing by the number of observations (n for the sample size and N for the population size). The speaker aims to demystify the statistical notation and emphasizes that the essence of these calculations is the same, whether for a sample or the entire population.
Mindmap
Keywords
💡Arithmetic Mean
💡Geometric Mean
💡Population
💡Sample
💡Random Sample
💡Parameter
💡Statistic
💡Confidence
💡Data Point
💡Notation
💡Mu (μ)
Highlights
Designing a product for men based on their height requires knowing the mean height of men in the United States.
The arithmetic mean is the most commonly referred to mean when simply saying 'mean'.
Measuring the height of every man in the United States is impractical due to the large population and data becoming outdated quickly.
A random sample of the population is used to estimate the mean height instead of measuring the entire population.
The importance of a random sample to avoid bias in statistical analysis is emphasized.
The process of calculating the sample mean involves adding heights and dividing by the number of samples.
A practical example of calculating the mean height from a sample of five men is provided.
The arithmetic mean of the sample is denoted with a bar over the variable, such as x̄.
The population mean is denoted by the Greek letter mu (μ).
Statistics are calculated from samples to estimate parameters of the entire population.
The concept of parameters versus statistics in statistical analysis is introduced.
The notation used for the sample mean and population mean in mathematical terms is explained.
The Greek letter sigma (Σ) is used to denote the sum of a series of numbers in mathematical notation.
The difference between calculating the sample mean and the population mean in terms of notation and practicality is discussed.
The transcript provides a step-by-step guide on how to calculate the mean height from a sample.
The importance of sample size in statistical analysis and its impact on confidence levels is mentioned.
The transcript concludes with an introduction to statistical notation and its practical application in calculating means.
Transcripts
Browse More Related Video

Statistics: Sample vs. Population Mean

Sample variance | Descriptive statistics | Probability and Statistics | Khan Academy
Symbols in statistics. Sample or Population?

8. Sampling and Standard Error

Sampling Distributions: Introduction to the Concept
Statistics: Populations & Samples and Parameters vs Statistics
5.0 / 5 (0 votes)
Thanks for rating: