Statistical Symbols
TLDRThe video script offers a gentle introduction to basic statistical symbols, aiming to demystify equations for newcomers to statistics. It explains the use of variables like X to represent data and subscripts to denote specific observations. The script also introduces the Greek letter Sigma for summation and differentiates between population parameters and sample statistics, using symbols like mu for population mean and X bar for sample mean. This foundational knowledge is crucial for understanding further statistical concepts.
Takeaways
- 🙂 Data in statistics is often represented with letters like X, which stand in for numbers.
- 📌 A variable's answer before it is known can be labeled with an X, making X a placeholder for any possible answer.
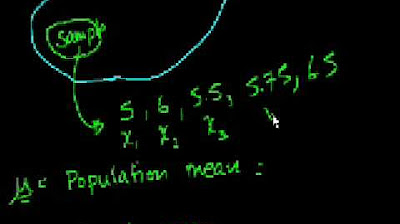
- 📝 For multiple data points, subscripts (e.g., X1, X2) are used with a single letter (like X) to avoid the cumbersome use of multiple or double letters.
- 📚 The subscript in notations like X sub i denotes which specific data point is being referred to, enhancing clarity and organization.
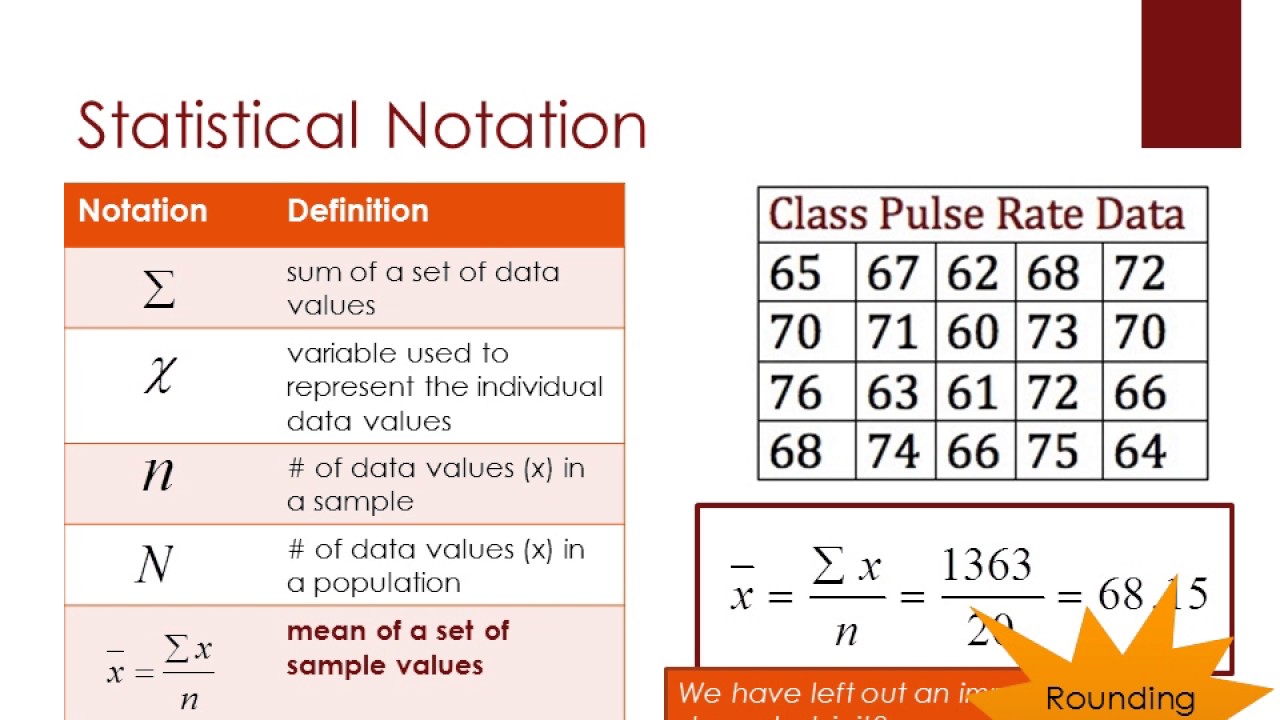
- ✏️ The Greek letter Sigma (Σ) symbolizes the sum of a series of numbers, playing a crucial role in statistical equations.
- 📈 The notation Σ from i=1 to n of X sub i means to add up all observations from the first to the nth, facilitating calculations over data sets.
- 📊 When Σ is used without specific limits (i=1 to n), it implies the addition of all elements in the set, simplifying notation.
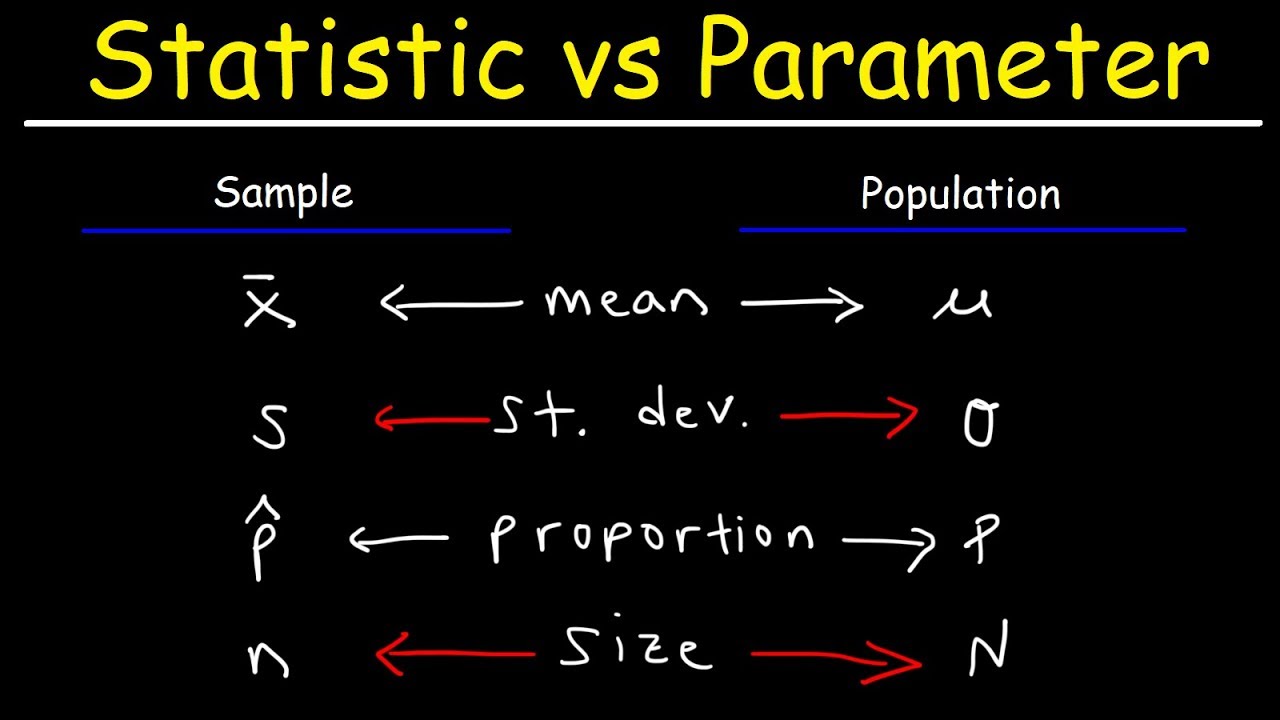
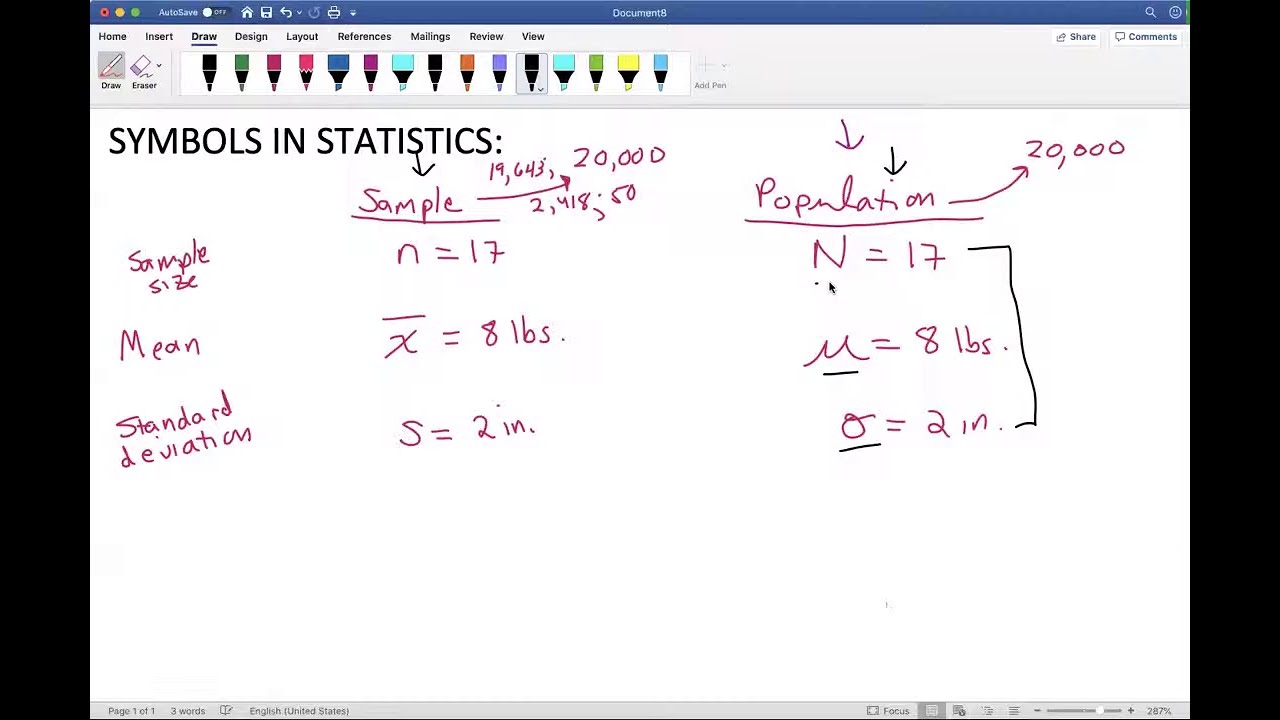
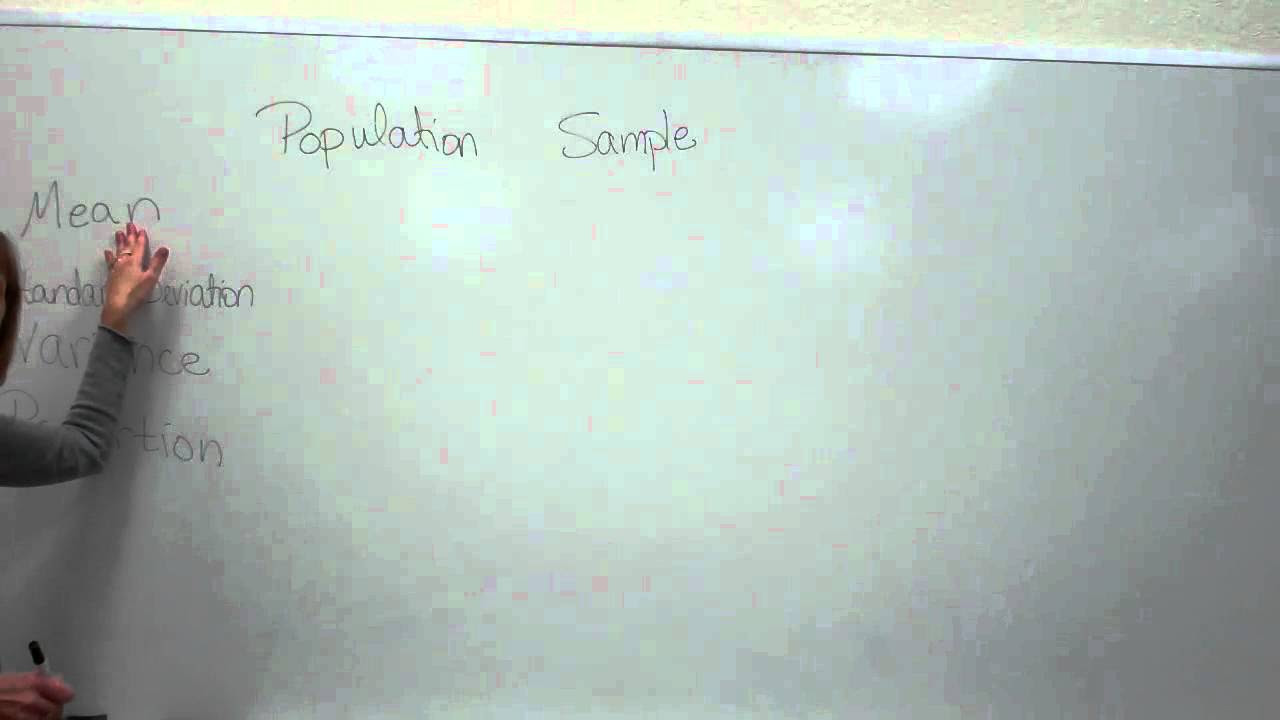
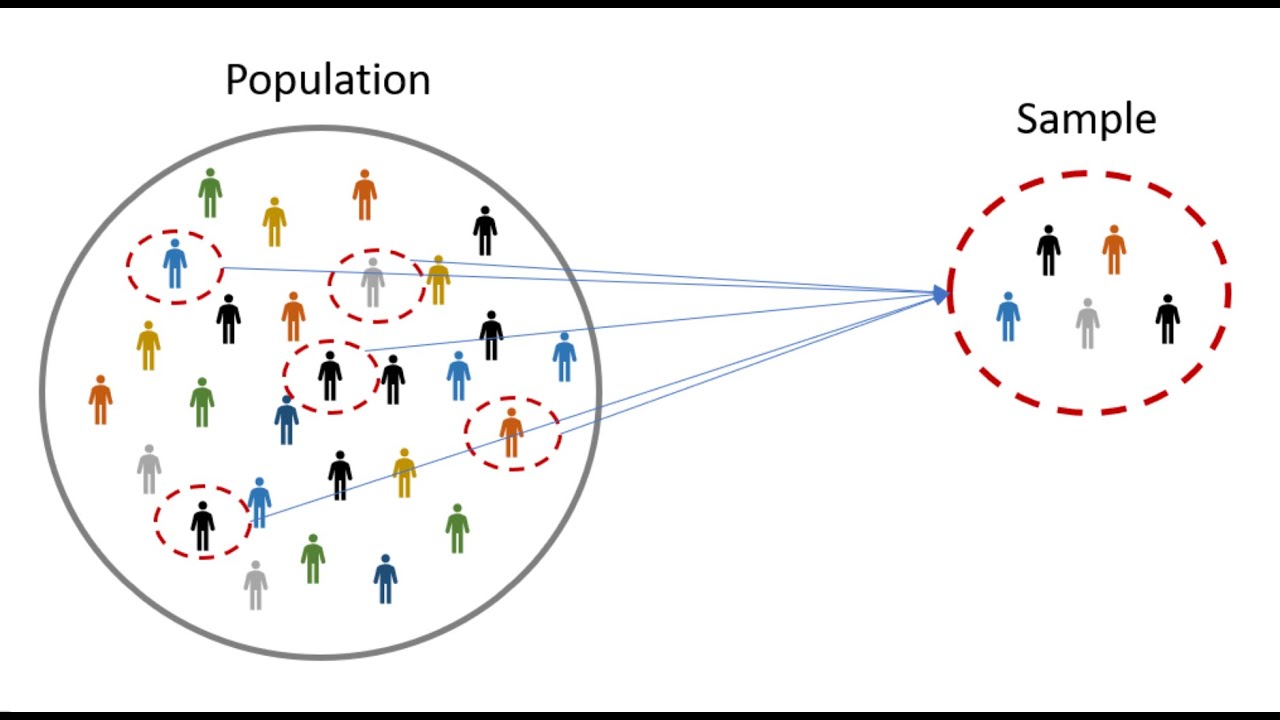
- 💾 Population parameters and sample statistics, while mathematically similar, differ based on whether data represents an entire population or a subset (sample).
- 🔮 Population mean is denoted by the Greek letter mu (μ), while sample mean can be represented by M or X bar (X̄), indicating the difference in data scope.
- 📉 Variance and standard deviation have distinct symbols for population (σ² and σ) and sample (s² and s) data, highlighting the calculation basis.
Q & A
What is the purpose of using a variable like X in statistics?
-The purpose of using a variable like X in statistics is to represent a numerical value that can vary. It serves as a placeholder for the actual data that will be collected or analyzed.
How does one denote multiple observations using a single letter variable?
-Multiple observations are denoted using a single letter variable with subscripts. For example, X_sub_I represents the i-th observation, where 'i' is the subscript that distinguishes each unique observation.
What is the significance of subscripts in statistical notation?
-Subscripts in statistical notation are used to differentiate between multiple observations or data points that are represented by the same variable. They provide a way to refer to specific instances within a dataset.
What does the Greek letter Sigma (Σ) represent in statistics?
-The Greek letter Sigma (Σ) represents the sum of all the terms that follow it. It is used in statistical equations to denote the addition of a series of numbers or variables.
How is the sum of all X_sub_i's from i=1 to N expressed?
-The sum of all X_sub_i's from i=1 to N is expressed as Σ (from i=1 to N) of X_sub_I, which means to add up all X values from the first observation to the last.
What are population parameters and sample statistics in the context of statistics?
-Population parameters are statistical measures calculated from data on an entire population, while sample statistics are calculated from a subset of the population, known as a sample.
How do you differentiate between the symbols for population mean and sample mean?
-The population mean is represented by the Greek letter mu (μ), while the sample mean is often represented by X with a bar above it (X̄) or sometimes by the letter M.
What is the difference between sample variance and population variance in terms of notation?
-Sample variance is denoted by the small letter s squared (s^2), whereas population variance is represented by the Greek letter Sigma squared (σ^2).
How is standard deviation represented in statistical notation?
-Standard deviation is represented with the small letter s for a sample standard deviation and the Greek letter Sigma (σ) for a population standard deviation.
What is the basic concept behind the use of variables and symbols in statistical equations?
-The basic concept behind the use of variables and symbols in statistical equations is to provide a standardized and efficient way to represent and manipulate data for analysis. This allows for clear communication of statistical findings and the ability to compare results across different studies.
Why is it important to understand statistical symbols and notations?
-Understanding statistical symbols and notations is important because it allows individuals to accurately interpret and communicate statistical findings. It also enables the application of statistical methods in data analysis and helps in the comparison and synthesis of research results.
Outlines
📚 Introduction to Basic Statistical Symbolism
This paragraph introduces the fundamental concepts of statistical symbolism, aimed at individuals new to statistics. It explains the use of variables like X to represent data and the implementation of subscripts to differentiate between multiple observations. The explanation includes an example of using X sub I to denote individual data points within a set. Additionally, it introduces the Greek letter Sigma (Σ) as a symbol for summation, illustrating how to add up all the values in a dataset. The paragraph emphasizes the importance of understanding these symbols to grasp statistical equations and future videos will reinforce this knowledge.
📈 Understanding Population and Sample Statistics
The second paragraph delves into the distinction between population parameters and sample statistics in the context of statistical analysis. It clarifies that while mathematically similar, they differ based on the data they represent—population parameters for entire populations and sample statistics for subsets of the population. The paragraph introduces specific symbols for these statistical measures: the Greek letter mu (μ) for population mean, X bar (X̄) for sample mean, small letter s squared (σ²) for sample variance, and the Greek letter Sigma squared (Σ²) for population variance. It also mentions the standard deviation, represented by s for sample and the Greek letter Sigma (σ) for population standard deviation. The summary aims to provide a basic understanding of these concepts and their significance in statistical analysis.
Mindmap
Keywords
💡Statistics
💡Variables
💡Subscripts
💡Sigma (Σ)
💡Observation
💡Population and Sample
💡Mean
💡Variance
💡Standard Deviation
💡Equations
💡Data Analysis
Highlights
Introduction to basic statistical symbolism.
Using letters like X to represent data and variables in statistics.
The concept of using subscripts to differentiate between multiple observations or data points.
Explanation of how to denote specific data points using subscripts (e.g., X sub one for the first observation).
The use of the Greek letter Sigma (Σ) to represent the sum of all observations.
How to read and interpret a summation equation (e.g., the sum from I equals 1 to N of X sub I).
Practical example of calculating the sum of a set of numbers using summation notation.
Differentiation between population parameters and sample statistics.
Explanation of the symbols used for population parameter mean (mu) and sample statistic mean (X bar or M).
Clarification of the symbols for population variance (Sigma squared) and sample variance (little s squared).
Description of the standard deviation symbols for both sample (s) and population (Greek letter Sigma).
The importance of understanding statistical symbols for grasping equations related to mean, squared deviations, and standard deviation.
The video provides a foundational understanding to approach more complex statistical concepts in the future.
The methodology of teaching statistics through simple explanations and practical examples.
The potential applications of understanding these statistical concepts in various fields such as social sciences.
The structured approach to learning statistics, starting from fundamental symbols and gradually moving to complex equations.
Transcripts
5.0 / 5 (0 votes)
Thanks for rating: