Population Mean And Sample Mean (Explanation and Walkthrough Example) |Statistics
TLDRThe video script discusses the distinction between the population mean (mu) and the sample mean (x bar), emphasizing that mu represents the true parameter of the entire population, while x bar is an estimate derived from limited data. It illustrates this concept using a simple example of a population's height data and demonstrates how increasing sample size leads to a more accurate approximation of mu. The message is clear: as sample size grows, the sample mean more closely approximates the population mean.
Takeaways
- 📊 The difference between population mean (mu) and sample mean (x bar) is crucial in statistics.
- 🎯 Mu represents the true mean of an entire population and is considered the parameter.
- 🔍 X bar is a statistic that serves as an approximation of the population mean based on sample data.
- 👥 It is rare to have the resources to perform a census; hence, samples are widely used.
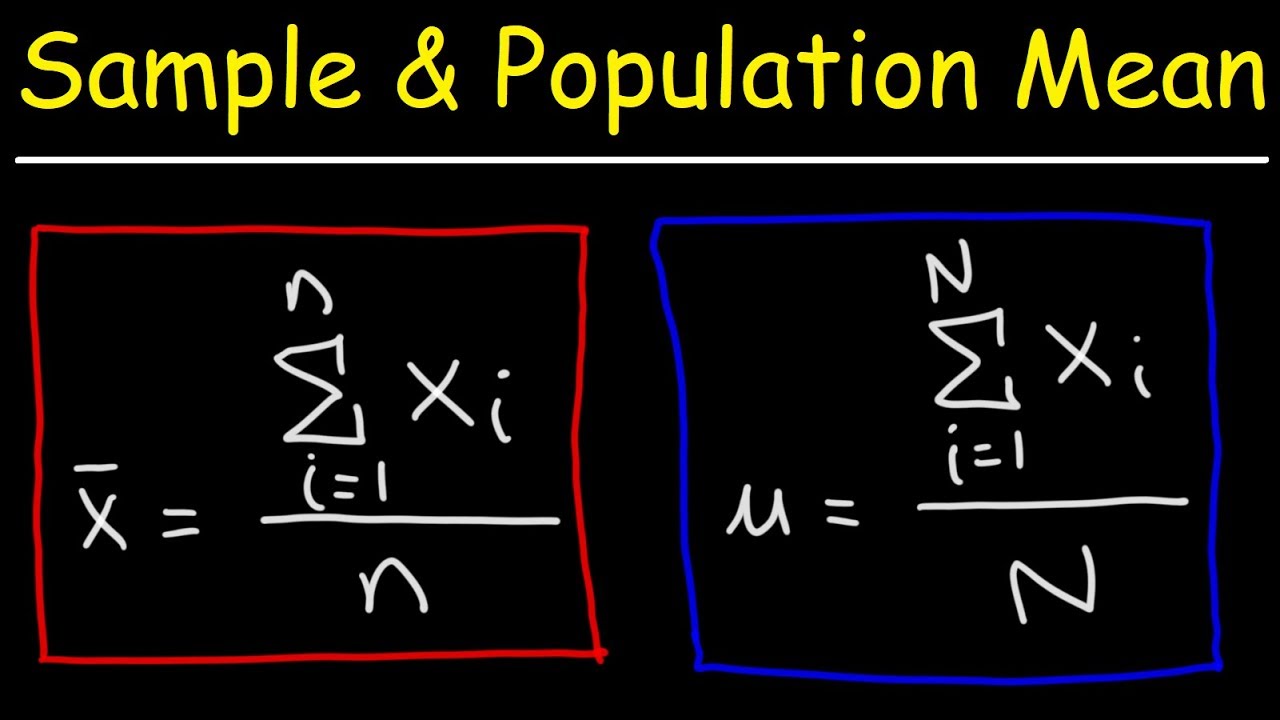
- 🧮 The formula for calculating mu is the sum of all values (x) divided by the total number of individuals (N).
- 📐 For the example given, the population mean (mu) is calculated to be 61.3 inches.
- 🔢 When determining x bar, the sum of the sample values is divided by the sample size (n), not the entire population.
- 🌟 As sample size increases, the approximation of x bar to mu tends to become more accurate.
- 📈 A larger sample size leads to a more precise representation of the population parameter.
- 🏢 Real-world applications often involve much larger populations and correspondingly larger sample sizes for accurate statistics.
- 💡 The key principle is that, with increased sample size, the reliability of x bar as an estimate for mu improves.
Q & A
What is the population mean (mu) in statistics?
-The population mean, denoted by mu (μ), is a parameter that represents the average of a entire population's data. It is considered the gold standard against which sample statistics are compared.
How is the population mean calculated?
-The population mean is calculated by summing up all the individual data points in the population and then dividing by the total number of data points (N). In the script, it was calculated as (60 + 71 + 76 + 56 + 52 + 65 + 49 + 53 + 67 + 64) / 10, which equals 61.3 inches.
What is the difference between the population mean and the sample mean?
-The population mean (mu) is the average of an entire population's data, while the sample mean (x̄ or x-bar) is a statistic that estimates the population mean using the data from a sample. The sample mean is used when it is impractical to measure the entire population.
How is the sample mean calculated?
-The sample mean is calculated by summing up all the data points in the sample and then dividing by the sample size (n). For example, using the data points 71, 56, and 64, the sample mean would be (71 + 56 + 64) / 3.
Why is it rare to calculate the population mean?
-Calculating the population mean is rare because it often requires a census or examining every single data point within the population, which can be very time-consuming and resource-intensive. Instead, samples are usually taken to approximate the population mean.
How does increasing the sample size affect the sample mean?
-As the sample size increases, the sample mean becomes a better estimator of the population mean. This is because a larger sample is more likely to accurately represent the population, leading to a closer approximation of the true population mean.
What is the relationship between sample size and the accuracy of statistical approximations?
-Larger sample sizes generally lead to more accurate statistical approximations. As more data points are included in the sample, the sample mean (x̄) gets closer to the population mean (μ), resulting in more reliable estimates.
What happens when you take a sample of 100 people in a city with a population of a thousand to approximate the population mean?
-By taking a sample of 100 people from a city with a population of a thousand, you can estimate the population mean based on the characteristics of that sample. As the sample size increases, the estimate becomes more accurate.
How does the concept of a sample mean relate to real-world statistical analysis?
-In real-world statistical analysis, it is impractical to measure every single member of a large population. Therefore, researchers use samples to make inferences about the population. The sample mean serves as an estimate for the population mean, allowing for statistical analysis without the need for a full census.
What is the significance of the sample mean in statistical analysis?
-The sample mean is significant in statistical analysis because it provides an estimate of the population mean using limited data. It allows researchers to make inferences and predictions about the larger population based on the data from a smaller, more manageable sample.
What does the video script imply about the importance of sample selection in statistics?
-The video script implies that while the sample mean is an approximation of the population mean, the accuracy of this approximation can be improved by carefully selecting a representative sample. This highlights the importance of proper sample selection in obtaining reliable statistical results.
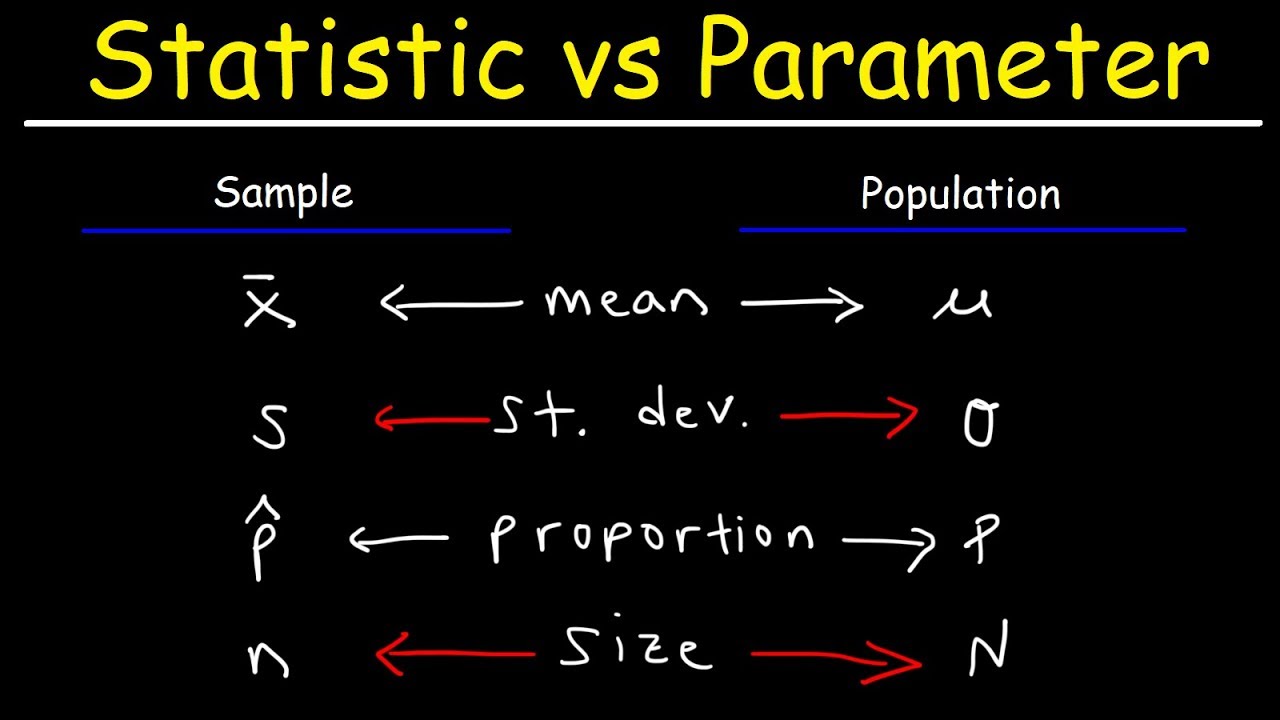
How does the concept of a parameter versus a statistic differ?
-A parameter is a numerical characteristic that describes a population, such as the population mean (mu). A statistic, on the other hand, is a numerical characteristic that describes a sample, such as the sample mean (x̄). Parameters are used to describe the entire population, while statistics are used to estimate parameters based on sample data.
Outlines
📊 Introduction to Population and Sample Means
This paragraph introduces the fundamental concepts of population mean (mu) and sample mean (x bar). It explains that the population mean is a parameter, representing the true value of the entire population, often used as a benchmark for statistical analysis. The sample mean, on the other hand, is a statistic that serves as an approximation of the population mean using limited data. The video script provides a clear distinction between the two, emphasizing that a full census is rarely feasible due to time and resource constraints, hence the reliance on samples to estimate the population parameter.
Mindmap
Keywords
💡Population Mean (mu)
💡Sample Mean (x bar)
💡Parameter
💡Statistic
💡Census
💡Approximation
💡Sample Size
💡Data
💡Estimate
💡Inferential Statistics
💡Heights
Highlights
The video discusses the difference between population mean (mu) and sample mean (x bar).
Population mean (mu) is referred to as the parameter, representing the gold standard for statistical comparison.
Sample mean (x bar) is a statistic used as an approximation to estimate the population mean with limited data.
Rarely can a census be conducted due to time and resource constraints; hence, samples are used.
For visualization, a simple population of 10 people with differing heights is used as an example.
The calculation of mu involves summing all values (x) and dividing by the total number (N).
The calculated population mean (mu) for the example is 61.3 inches.
Two types of samples are examined: one with three individuals and another with six.
The sample mean (x bar) is calculated by summing values and dividing by the sample size (n).
A sample of three yields a sample mean of 63.67 inches, which is close to the population mean.
Increasing the sample size to six results in a sample mean of 60.33 inches, showing increased approximation to the population mean.
As sample size increases, the approximation of x bar to mu improves.
In practical scenarios, a large population is often approximated by a smaller sample.
The video provides a clear explanation of how sample statistics can estimate population parameters.
The importance of sample size in achieving accurate statistical approximations is emphasized.
The video concludes by encouraging viewers to ask questions for further clarification or discussion.
Transcripts


5.0 / 5 (0 votes)
Thanks for rating: