How to calculate Standard Deviation and Variance
TLDRThis tutorial effectively explains the concepts of mean, variance, and standard deviation, using a relatable example of job applications. It guides viewers through the process of calculating sample variance and standard deviation, emphasizing the importance of understanding these statistical measures. The step-by-step breakdown, including the creation of an organized table for calculations, ensures clarity and ease of understanding. The summary highlights the key points: the sample variance (33.2) and the sample standard deviation (5.76), both measured in jobs, and the sample mean (14 jobs), reinforcing the relevance of these statistical tools in analyzing data.
Takeaways
- 📊 Standard deviation and variance are related concepts used in statistics to measure data spread.
- 🔢 To find the standard deviation, first calculate the sample variance.
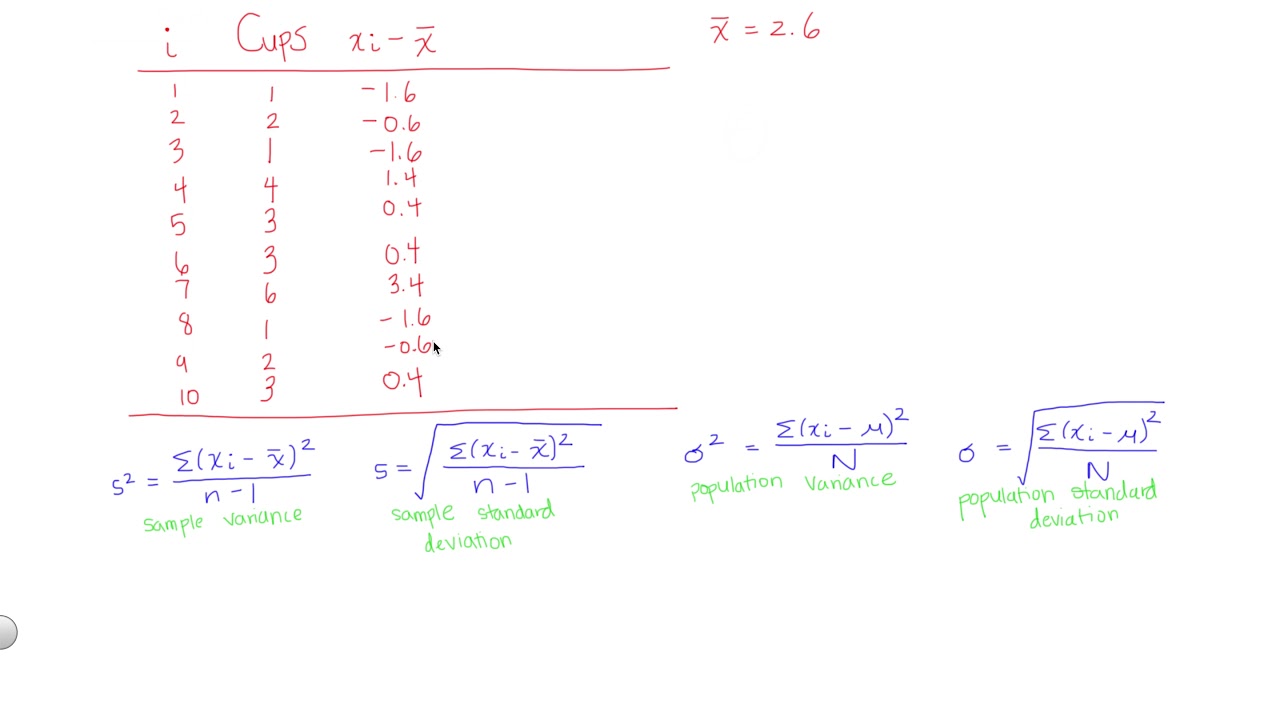
- 🌟 The sample variance (s^2) is given by the formula: Σ(X - X̄)^2 / (n - 1).
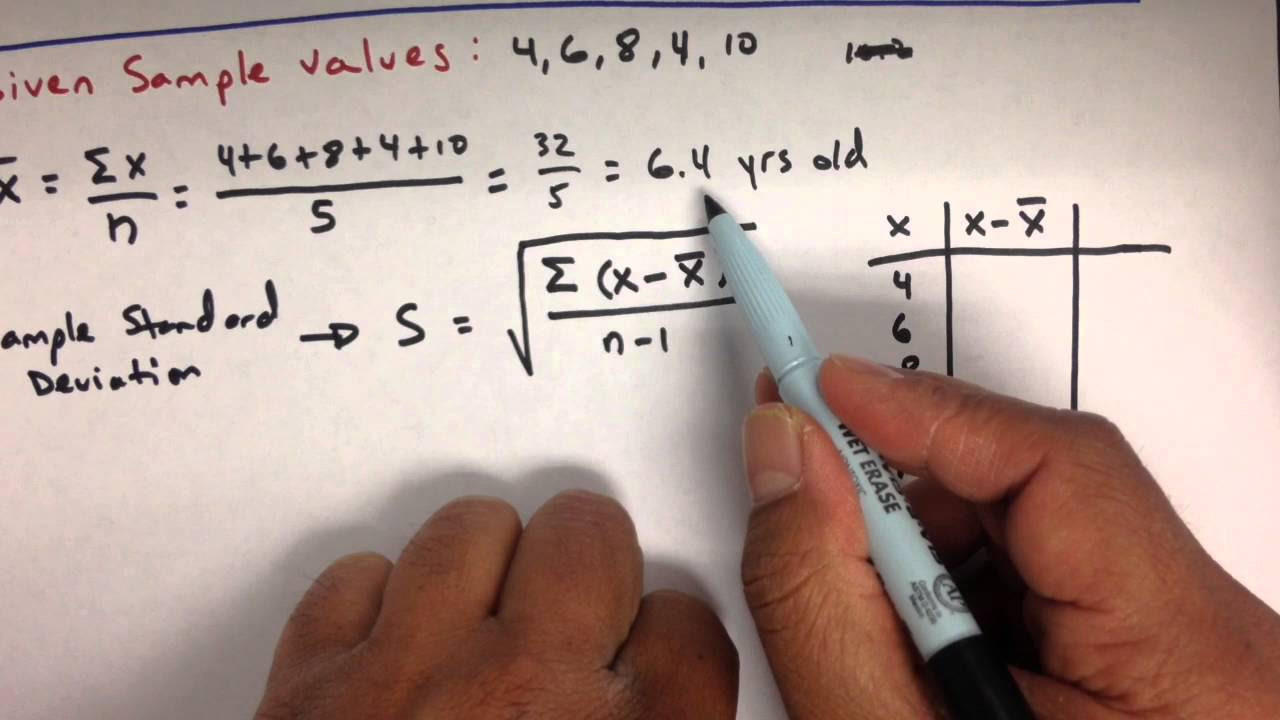
- 📈 The mean (X̄) is calculated by summing all observations and dividing by the number of observations.
- 🔄 The sum of the differences between each observation and the mean should be zero.
- 📞 When finding the variance, square the differences between each observation and the mean, disregarding the sign.
- 🔢 The sample variance is the average of the squared differences from the mean.
- 🚀 The sample standard deviation (s) is the square root of the sample variance.
- 🎯 Both the sample standard deviation and mean are in the same units, allowing for direct comparison.
- 📋 It is recommended to use a table to stay organized while performing calculations.
- 📈 This tutorial serves as a review and introduction to the concepts of standard deviation and variance in calculus.
Q & A
What is the relationship between standard deviation and variance?
-Standard deviation and variance are closely related. The standard deviation is the square root of the variance. Both measures provide insights into the dispersion of a dataset.
What is the purpose of calculating the mean in this context?
-The mean, or average, is calculated to provide a central value for the dataset. It is used as a reference point to calculate the deviations that contribute to the variance and standard deviation.
How is the sample variance calculated?
-The sample variance is calculated by taking the sum of the squared differences between each observation and the mean, and then dividing by the sample size minus one (n-1).
What does the sample size (n) represent in the calculations?
-The sample size (n) represents the number of observations in the dataset. It is used in the denominator of the variance formula to account for the sample's sensitivity to the specific data points included.
Why is the square root of the sample variance taken to find the standard deviation?
-The square root of the sample variance is taken to find the standard deviation to ensure that the standard deviation is in the same units as the original data, allowing for a meaningful comparison of dispersion across different datasets.
How does the sign of the difference between the observation and the mean affect the variance calculation?
-The sign of the difference between the observation and the mean does not affect the variance calculation because the differences are squared, turning all values positive. This ensures that the variance is not influenced by the direction of the deviation but only by the magnitude.
What is the significance of the sample mean being equal to 14 jobs in this example?
-The sample mean being equal to 14 jobs indicates that, on average, the individuals in the sample applied for 14 jobs. This provides a central value for the dataset against which the variability can be measured.
How does the sample standard deviation of 5.76 jobs reflect the dispersion of the data?
-A sample standard deviation of 5.76 jobs indicates that the number of jobs applied for by the individuals in the sample is spread out by approximately 5.76 jobs on either side of the mean. This measure provides a sense of how much the individual observations deviate from the average.
What is the purpose of creating a table to organize the calculations?
-Creating a table helps to systematically organize the data and calculations, making it easier to follow the steps and ensure accuracy. It also allows for a clear presentation of the results and facilitates the verification of the calculations.
How can you check the accuracy of the calculations for the differences between the observations and the mean?
-The accuracy of the calculations for the differences between the observations and the mean can be checked by ensuring that the sum of these differences equals zero. This is a mathematical property that holds true when the calculations are correct.
What is the significance of the units of the sample variance and standard deviation being the same as the original data?
-The units of the sample variance and standard deviation being the same as the original data is significant because it allows for a direct interpretation of the magnitude of dispersion in the context of the data. It provides a clear and meaningful measure of variability that can be compared across different datasets.
Outlines
📊 Introduction to Calculating Standard Deviation and Variance
This paragraph introduces the topic of calculating the standard deviation and variance, emphasizing their relationship. It sets the stage for a tutorial that will walk through the process of calculating these statistical measures using a sample dataset. The problem presented involves determining the mean, variance, and standard deviation for the number of jobs applied for by a group of six people. The paragraph explains the use of symbols, the formula for sample variance, and the importance of organizing calculations in a table format. It also outlines the steps to calculate the sample mean, which is a precursor to finding the variance and standard deviation.
Mindmap
Keywords
💡Standard Deviation
💡Variance
💡Mean
💡Sample Size
💡Observations
💡Data Analysis
💡Calculation
💡Distributions
💡Squared Differences
💡Numerator
💡Contextualization
Highlights
The tutorial introduces the concepts of standard deviation and variance, emphasizing their interrelation.
Standard deviation and variance are key statistical measures used to understand data distribution.
The tutorial presents a practical problem involving the calculation of mean, variance, and standard deviation for a set of job applications.
The sample standard deviation is calculated as the square root of the sample variance.
A step-by-step method for calculating sample variance is provided, using a clear and organized table format.
The mean (x-bar) is calculated by summing all observations and dividing by the number of observations.
The process of calculating the mean is demonstrated with a specific example, using actual numbers from the job applications.
The calculation of the observation-minus-mean column is explained, which is crucial for finding the variance.
It is noted that the sum of the observation-minus-mean column should always equal zero, serving as a check for calculations.
The calculation of the squared differences, which are used to find the sample variance, is detailed with examples.
The sample variance is calculated using the sum of squared differences divided by the sample size minus one.
The sample standard deviation is derived by taking the square root of the sample variance.
The importance of units consistency between standard deviation and sample mean is highlighted for comparison purposes.
The tutorial serves as a review and introduction to the concepts of standard deviation and variance in the context of calculus.
The use of a table to organize calculations is recommended for clarity and accuracy.
The tutorial demonstrates the application of statistical methods to real-world data, enhancing practical understanding.
Transcripts
Browse More Related Video
Measures of Dispersion (Ungrouped Data) | Basic Statistics

Statistics: Standard deviation | Descriptive statistics | Probability and Statistics | Khan Academy
How to Find the Standard Deviation, Variance, and Mean of a Sample and a Population - Easy Tutorial
How to Calculate Standard Deviation and Variance by Hand
Variance and Standard Deviation: Sample and Population Practice Statistics Problems
Measures of Spread & Variability: Range, Variance, SD, etc| Statistics Tutorial | MarinStatsLectures
5.0 / 5 (0 votes)
Thanks for rating: