How to Calculate Standard Deviation and Variance by Hand
TLDRThis instructional video teaches viewers how to calculate four key measures of variability: sample variance, sample standard deviation, population variance, and population standard deviation. The video emphasizes the commonality in the initial steps of these calculations, which involve finding the sum of squared deviations from the mean. It demonstrates the process using a dataset of coffee consumption and guides through the calculations step by step, including the use of a table to organize the steps. The video concludes with the formulas and results for each measure, highlighting the slight differences in the final steps for sample versus population calculations.
Takeaways
- 📚 The video teaches how to calculate four main measures of variability: sample variance, sample standard deviation, population variance, and population standard deviation.
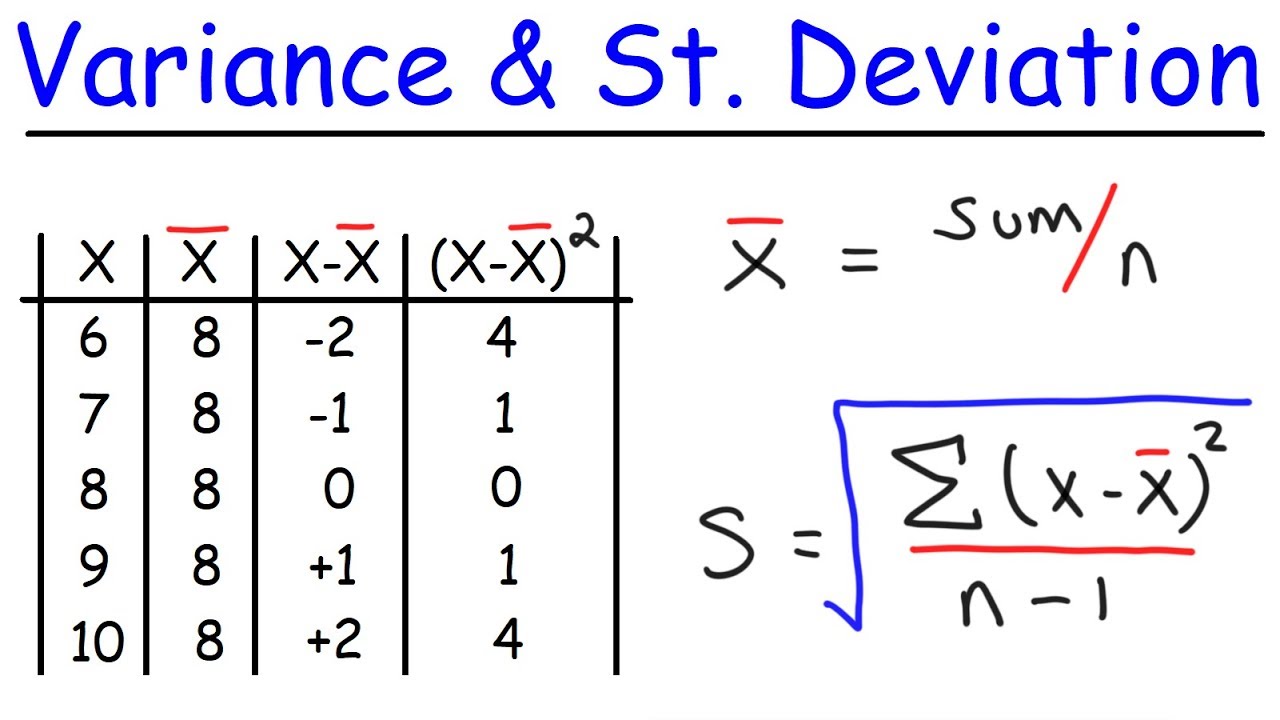
- 🔍 The formulas for these measures share similarities, particularly in the numerators, which involve taking each value, subtracting the mean, squaring the result, and summing them up.
- 📈 The distinction between sample and population data depends on the scope of interest; if generalizing beyond a specific group, it's a sample, otherwise it's a population.
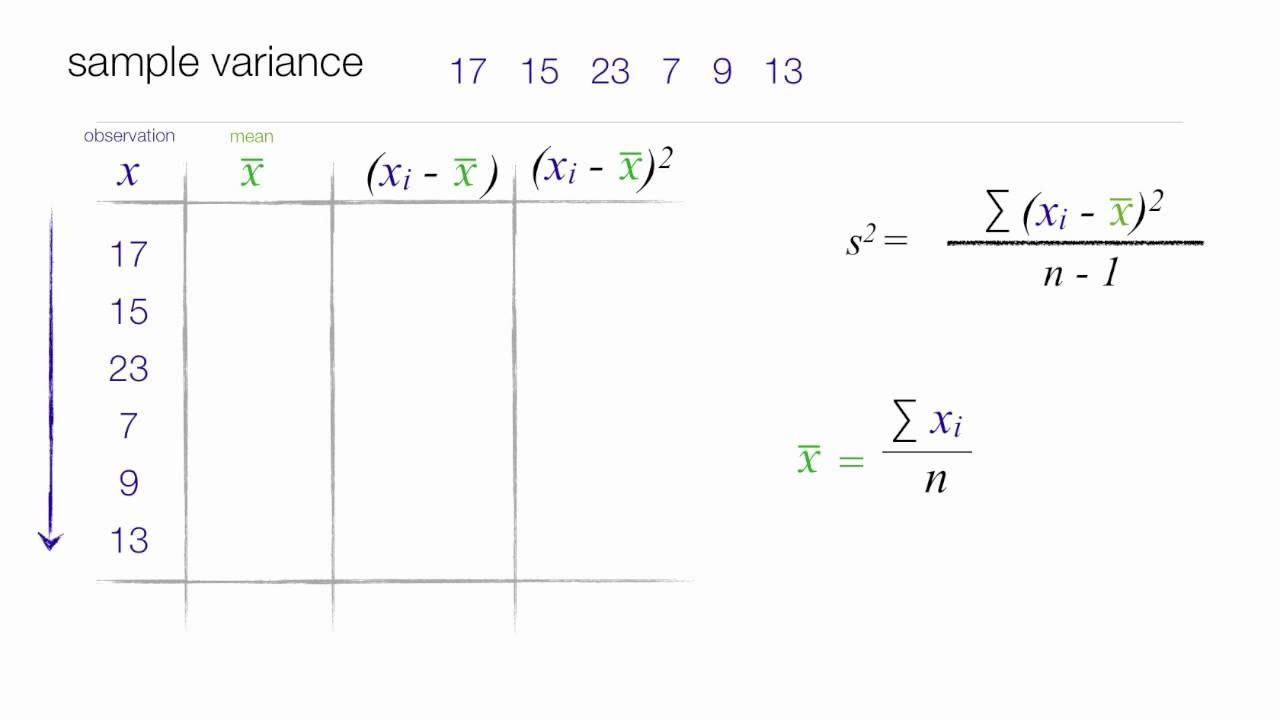
- 📝 The process involves creating a table and following a series of steps to calculate the desired measures of variability.
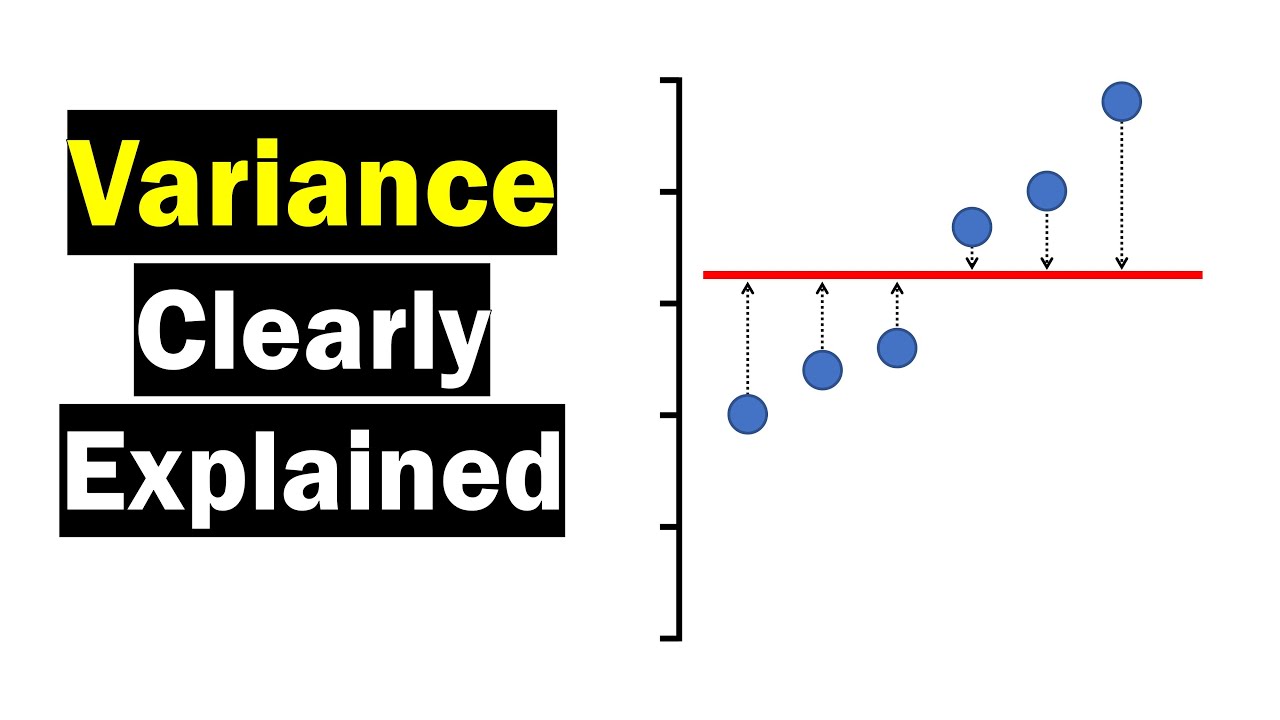
- ⚖️ The first step in calculating variability is to find the deviations of each value from the mean, which is essential for understanding standard deviations.
- 🧮 The mean of the data set used in the video is given as 2.6, and deviations are calculated by subtracting this mean from each data point.
- 🔢 To deal with the issue of deviations summing to zero, the video suggests squaring the deviations, which removes the negative sign and allows for further calculations.
- 📊 The sum of the squared deviations from the mean is called the sum of squares (SS), which is a crucial component in calculating all four measures of variability.
- 📉 For sample variance, the sum of squares is divided by (n - 1) (where n is the sample size), and for population variance, it is divided by n.
- 📏 The sample standard deviation is found by taking the square root of the sample variance, and similarly, the population standard deviation is the square root of the population variance.
- 🎯 The video concludes with the calculation of both sample and population variances and standard deviations, highlighting the process and the final results.
Q & A
What are the four main measures of variability discussed in the video?
-The four main measures of variability discussed in the video are sample variance, sample standard deviation, population variance, and population standard deviation.
What is the significance of the numerators in the formulas for these measures of variability?
-The numerators across all four formulas are essentially identical, involving taking each x-value, subtracting the mean of all the values, squaring that value, and adding all those up. This means that the initial steps for calculating any of these measures of variability are the same.
What does the video suggest using as the first step in calculating measures of variability?
-The video suggests calculating the deviations of each value from the mean as the first step in calculating measures of variability.
Why can't we simply take the average of the deviations to find the standard deviation?
-We can't take the average of the deviations to find the standard deviation because the sum of the deviations will always equal zero, which would make the average zero, regardless of the original data.
What is the sum of squares and why is it important in calculating measures of variability?
-The sum of squares is the sum of each squared deviation from the mean across all values. It is important because it is used in the numerator for calculating all measures of variability, and it represents the total variability in the data set.
How does the process of calculating sample variance differ from calculating population variance?
-The process of calculating sample variance involves dividing the sum of squares by n-1 (the sample size minus one), whereas calculating population variance involves dividing the sum of squares by n (the population size).
What is the relationship between variance and standard deviation?
-Standard deviation is the square root of variance. It is a measure of the typical amount that scores deviate from the mean, and it is derived from the variance by taking its square root.
Why do we use n-1 instead of n when calculating sample variance?
-We use n-1 instead of n when calculating sample variance as a way to make the sample statistics approximate the corresponding population parameters more accurately. It's a statistical method known as Bessel's correction.
How does the video demonstrate the process of calculating these measures of variability?
-The video demonstrates the process by using a table and a series of steps that include calculating deviations from the mean, squaring these deviations, summing them up to get the sum of squares, and then using this sum to calculate the different measures of variability.
What is the practical example used in the video to illustrate the calculation of these measures of variability?
-The practical example used in the video is the number of cups of coffee that each student in the presenter's class drinks per day. This data is used to illustrate both sample and population calculations.
Outlines
📚 Introduction to Variability Measures
This paragraph introduces the concept of variability and its four main measures: sample variance, sample standard deviation, population variance, and population standard deviation. The speaker emphasizes that although the formulas for these measures will be discussed later, it's important to note the similarities in their numerators. The process involves taking each data point, subtracting the mean, squaring the result, and summing these values. The speaker uses the example of the number of cups of coffee students drink per day to illustrate the concept. The data can be treated as either a sample or a population, depending on the context. The paragraph concludes with the setup of a table to guide the calculations, starting with calculating deviations from the mean.
🔍 Calculating Variability Measures: Steps and Formulas
The second paragraph delves into the process of calculating the measures of variability. The speaker explains that the first step is to find the sum of squares, which is the sum of the squared deviations from the mean. This is done by subtracting the mean from each data point, squaring the result, and adding these values together. The sum of squares is represented as SS and is a crucial component in the formulas for all four measures of variability. The speaker then demonstrates how to calculate the sample variance by dividing the sum of squares by n-1 (where n is the number of data points), and the sample standard deviation by taking the square root of the sample variance. For population parameters, the sum of squares is divided by n, not n-1. The paragraph concludes with the calculation of both the population variance and standard deviation, providing the final values for these measures.
Mindmap
Keywords
💡Variability
💡Sample Variance
💡Sample Standard Deviation
💡Population Variance
💡Population Standard Deviation
💡Deviations from the Mean
💡Sum of Squares (SS)
💡Sample Notation
💡Population Notation
💡Data Points
💡Sample Size (n)
Highlights
Introduction to calculating four main measures of variability: sample variance, sample standard deviation, population variance, and population standard deviation.
Highlighting the similarities in the numerators of the formulas for all four measures of variability.
Explanation of the notation changes based on whether data is a sample or a population.
Process of calculating each x-value by subtracting the mean and squaring the result.
Use of a table to systematically calculate the required measures.
Example data provided: number of cups of coffee students drink per day.
Treating data as either sample data or population data based on the context.
Calculation of deviations of each value from the mean as the first step.
Mean of all scores (x-bar) is given as 2.6 for the sample data.
The problem with averaging deviations due to them summing up to zero.
Two options to address the issue of negative signs: taking absolute values or squaring the values.
Historical debate in statistics leading to the preference for squaring values.
Calculation of the sum of squares (SS) as the sum of squared deviations from the mean.
Sum of squares represented as SS and its role in calculating measures of variability.
Process to calculate sample variance using the sum of squares and dividing by n-1.
Derivation of sample standard deviation by taking the square root of sample variance.
Calculation of population variance and standard deviation using the sum of squares and dividing by n.
Explanation of the conservative approach in statistics by using n-1 for sample calculations.
Final results and conclusion of the video with the four calculated measures of variability.
Transcripts
Browse More Related Video
Variance - Clearly Explained (How To Calculate Variance)
Variance and Standard Deviation With Microsoft Excel - Descriptive Statistics
Measures of Dispersion (Ungrouped Data) | Basic Statistics
How to calculate Standard Deviation and Variance
Variance and Standard Deviation: Why divide by n-1?
How to Find the Standard Deviation, Variance, and Mean of a Sample and a Population - Easy Tutorial
5.0 / 5 (0 votes)
Thanks for rating: