What is Variance in Statistics? Learn the Variance Formula and Calculating Statistical Variance!
TLDRThe video script introduces the concept of variance in statistics, emphasizing its importance in measuring the spread of data while reducing sensitivity to outliers. It explains the process of calculating variance by first determining the mean of a data set, then finding the deviation of each data point from the mean, and finally squaring and averaging these deviations. The distinction between population variance (denoted by Sigma squared) and sample variance (denoted by S squared) is clarified, with the latter adjusted by dividing by n-1 to account for sample size. The video aims to deepen understanding of variance and its application in statistical analysis.
Takeaways
- 📈 The range can be less useful when dealing with outliers in data.
- 🔍 To address the outlier issue, the concept of variance is introduced in statistics.
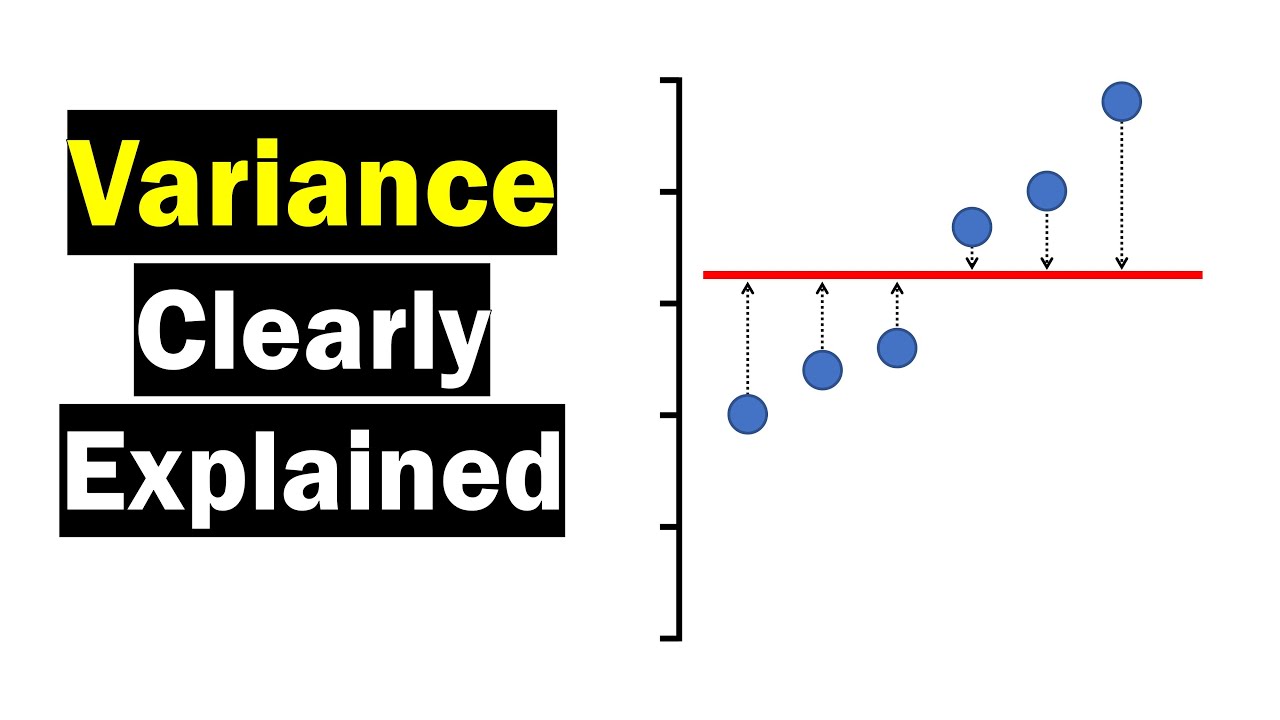
- 🌟 Variance is a critical measure in statistics that indicates how spread out data is, offering a different perspective from the range.
- 📊 Variance calculation involves taking each data point, subtracting the mean, and then squaring the result to eliminate negative values.
- 🔢 The squared deviations are then summed up and divided by the number of data points to find the average squared deviation from the mean.
- 🌐 This process yields a positive value that represents the spread of the data, regardless of the data's distribution around the mean.
- 📝 The variance for a population is denoted as σ² (Sigma squared), while the variance for a sample is denoted as s².
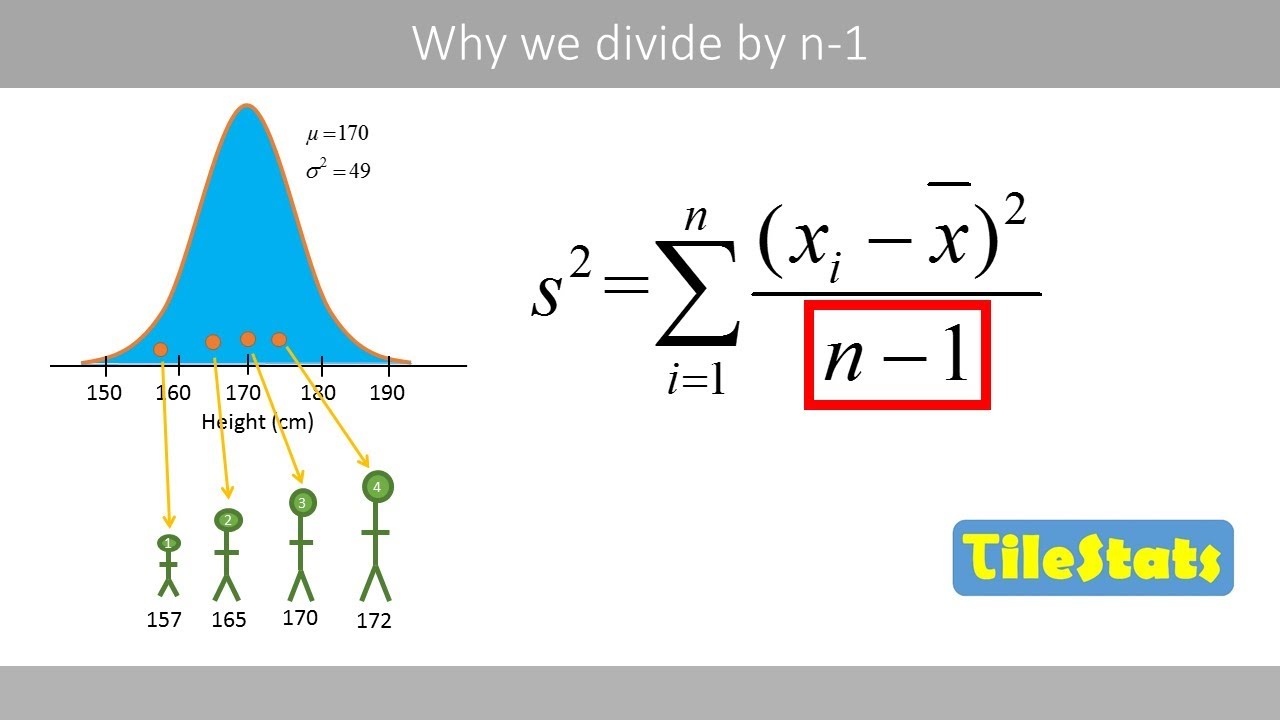
- 🔄 When calculating sample variance, the formula is slightly modified to (Σ(xᵢ - x̄)²) / (n - 1), where n is the number of samples.
- 🎯 The difference between sample variance (s²) and population variance (σ²) lies in the denominator: n for a population, and n-1 for a sample.
- 📚 Understanding the distinction between sample and population means is crucial for applying the correct formula when calculating variance.
- 📈 Variance provides insight into the dispersion of data points around the mean, with a larger variance indicating a greater spread of data and vice versa.
Q & A
What is the main issue with using the range to measure the spread of data?
-The main issue with using the range to measure the spread of data is that it is highly susceptible to outliers, which can make the range almost useless as it does not provide a reliable measure of dispersion for the entire dataset.
What is the concept of variance in statistics?
-The concept of variance in statistics is a measure of how spread apart a dataset is. It is calculated by taking the average of the squared differences from the mean, providing a way to assess the dispersion of data that is less sensitive to outliers compared to the range.
Why is understanding variance important in statistics?
-Understanding variance is crucial in statistics because it provides a fundamental measure of data dispersion. It helps in determining the spread of data around the mean and is closely related to other important statistical concepts such as standard deviation. Mastery of variance is essential for a deeper understanding of various statistical analyses and interpretations.
What is the formula for calculating the population variance?
-The formula for calculating the population variance is Σ(x - μ)² / N, where x represents each data point, μ is the population mean, and N is the total number of data points in the population.
How is the sample variance calculated differently from the population variance?
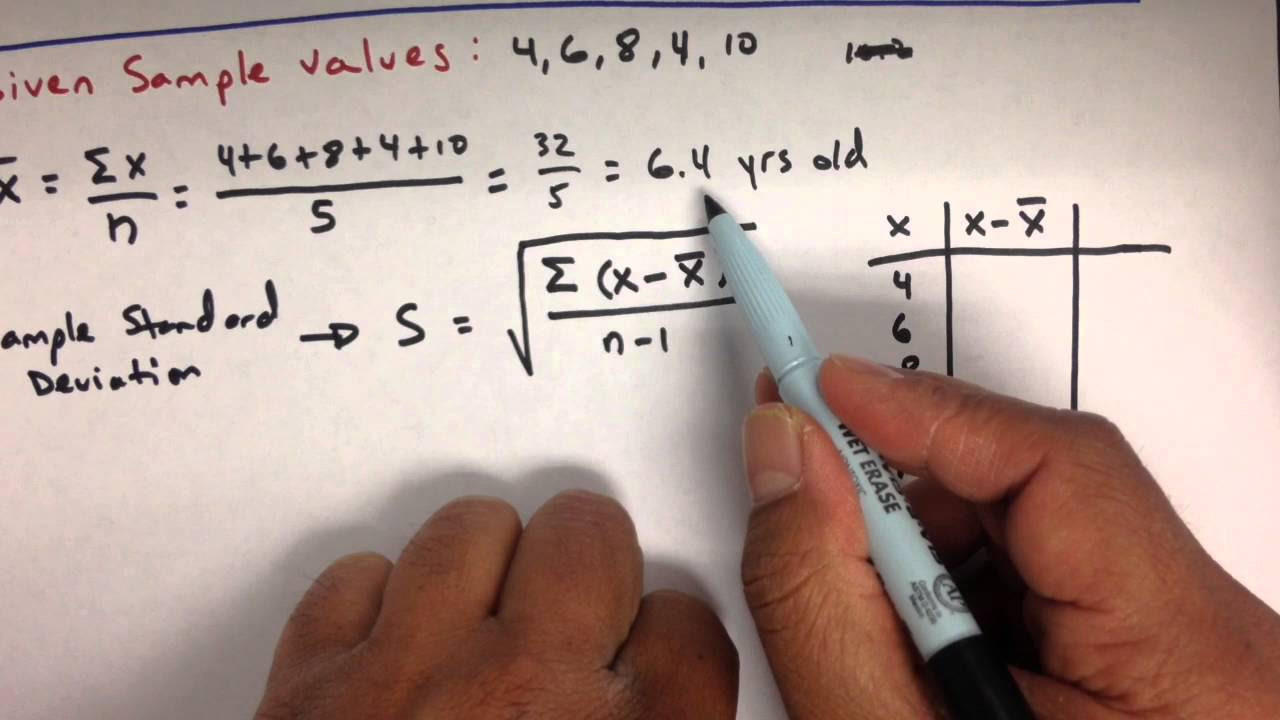
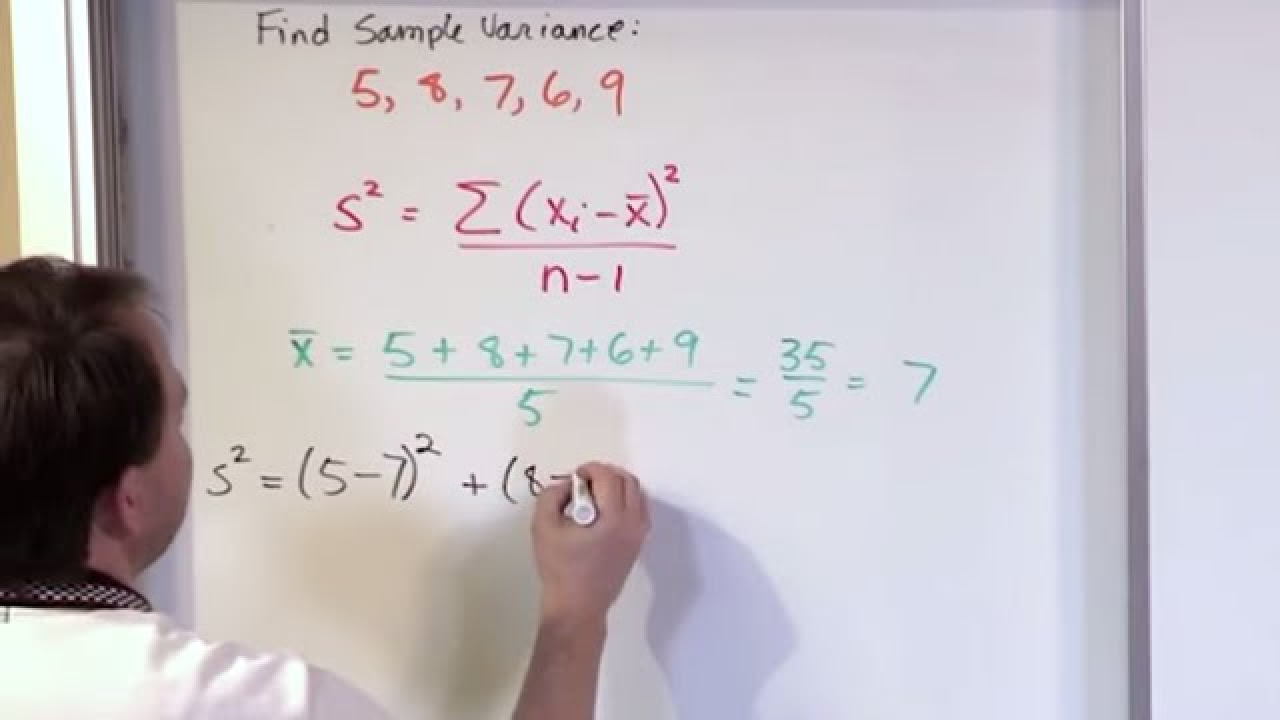
-The sample variance is calculated using the formula Σ(x - x̄)² / (n - 1), where x represents each data point, x̄ is the sample mean, and n is the number of data points in the sample. The key difference is the use of n - 1 in the denominator, which is known as Bessel's correction, making the sample variance an unbiased estimator of the population variance.
What is the purpose of squaring the differences between data points and the mean when calculating variance?
-Squaring the differences between data points and the mean is done to eliminate the problem of negative values that would result from subtracting the mean. Since the mean is at the center, half of the data points will be above and half below, leading to positive and negative differences. Squaring these differences ensures that all values are positive, which allows for a proper calculation of the average spread.
Why is the sample variance an unbiased estimator of the population variance?
-The sample variance is an unbiased estimator of the population variance because dividing by n - 1 in the calculation compensates for the fact that a sample is being used instead of the entire population. This adjustment ensures that the sample variance provides an accurate estimate of the population variance by accounting for the additional variability inherent in a sample.
What does the symbol Σ represent in the variance formula?
-The symbol Σ (Sigma) in the variance formula represents the summation operation. It indicates that you should add up all the values that result from the calculation within the parentheses for each data point.
What is the significance of the squared term in the variance formula?
-The squared term in the variance formula is significant because it transforms all differences into positive values, regardless of whether they are above or below the mean. This allows for a consistent measure of dispersion that is not affected by the direction of the deviation from the mean.
How does the concept of variance relate to the standard deviation?
-Variance is the square of the standard deviation. The standard deviation is the square root of the variance, which brings the units back to the original data scale. Both measures provide insights into the spread of data, but the standard deviation is often preferred as it is in the same units as the data and is more intuitive to interpret.
What is the role of the mean in calculating variance?
-The mean plays a central role in calculating variance as it serves as the reference point from which deviations of individual data points are measured. The variance quantifies the average of these squared deviations, providing a measure of how spread out the data is around the mean.
Outlines
📊 Introduction to Variance and Data Spread
This paragraph introduces the concept of variance as a statistical measure to understand the spread of data. It explains that while the range is a simple measure, it is highly susceptible to outliers. Variance, on the other hand, provides a more robust measure of data spread by considering the deviation of each data point from the mean. The importance of understanding variance is emphasized, as it is a fundamental concept in statistics alongside the mean. The paragraph sets the stage for a deeper exploration of variance and its calculation.
🔢 Calculating Average Deviations from the Mean
This paragraph delves into the process of calculating the average deviations of data points from the mean, which is a step towards understanding variance. It explains that by subtracting the mean from each data point, we obtain the deviation, and by summing these deviations and dividing by the number of data points, we get an average deviation. However, this method results in both positive and negative values, which when averaged, tend to cancel each other out, leading to a sum of zero. This issue is addressed in the next paragraph.
📈 Squaring Deviations to Solve Negative Values
The paragraph discusses a solution to the problem of negative values in the calculation of average deviations. By squaring each deviation (the difference between each data point and the mean), the negative values become positive, thus avoiding the issue of them canceling each other out. This squared deviation is then summed up and divided by the number of data points to calculate the population variance, a measure of data spread around the mean. The paragraph emphasizes the importance of understanding this concept, as it is central to statistical analysis.
📉 Understanding Population and Sample Variance
This paragraph distinguishes between population variance (denoted by Sigma squared) and sample variance (denoted by S squared). It explains that population variance refers to the spread of the entire data set around the population mean (mu), while sample variance refers to the spread of a sample of data around the sample mean (x-bar). The calculation for both is similar, with the key difference being the divisor: the total number of data points in the population (n) for population variance, and the number of samples minus one (n-1) for sample variance. The paragraph concludes by reinforcing the importance of understanding variance and its calculation for statistical analysis.
Mindmap
Keywords
💡range
💡outliers
💡variance
💡standard deviation
💡mean
💡deviation
💡sensitivity to outliers
💡squared deviations
💡population variance
💡sample variance
💡dispersion
Highlights
The concept of variance is introduced as a measure of data spread that is less susceptible to outliers.
Variance is defined as the average of the squared differences from the mean, providing a statistical measure of dispersion.
The calculation of variance involves subtracting the mean from each data point, squaring the result, and then averaging these squared differences.
Squaring the differences from the mean ensures that all values are positive, allowing for a clear measure of spread without the issue of negative deviations.
The symbol for variance is Sigma (Σ), with a square denoting that it is a measure of squared deviations from the mean.
The distinction between population variance (Σ²) and sample variance (s²) is clarified, with the latter being used when only a sample of the data is available.
For sample variance, the formula is modified to divide by the number of samples minus one (n-1), instead of the total number of samples (n).
The population variance is denoted with the population mean (μ), while the sample variance uses the sample mean (x̄).
Understanding the difference between a sample and a population, as well as their respective means, is crucial for correctly calculating variance.
Variance is a fundamental concept in statistics that is essential for understanding data distribution and analysis.
The mean of a data set is described as the 'middle-of-the-road' value, representing the center of gravity for the data.
The discussion emphasizes the importance of internalizing the concept of variance for effective statistical analysis.
The transcript provides a logical walkthrough of the concept of variance, aiming to ensure a deep understanding beyond just the equation.
The process of calculating variance is detailed, including the reasoning behind each step and the implications of the calculations.
The transcript highlights the practical applications of variance in understanding the spread of data points in relation to the mean.
A key takeaway is that variance provides a measure of data spread that is more nuanced than the range, considering each data point's deviation from the mean.
Transcripts
Browse More Related Video
Variance - Clearly Explained (How To Calculate Variance)
Variance and Standard Deviation: Sample and Population Practice Statistics Problems
Why do we divide by n-1 and not n? | shown with a simple example | variance and sd

Statistics: Standard deviation | Descriptive statistics | Probability and Statistics | Khan Academy
Lesson 15 - Calculating Variance in Statistics
Calculating the Mean, Variance and Standard Deviation, Clearly Explained!!!
5.0 / 5 (0 votes)
Thanks for rating: