Averages and Uncertainty Calculations
TLDRThe video explains how to calculate the average and uncertainty of a data set. It provides two example problems. First, it calculates the average and uncertainty of 8 test scores. The average is the sum divided by the number of scores. The uncertainty is half the range between the maximum and minimum scores. The second example calculates average velocity over 10 seconds, then determines the uncertainty using the same process. The summary demonstrates how averaging data and quantifying uncertainty provides concise yet accurate representation of data sets.
Takeaways
- 😀 The video explains how to calculate the average and uncertainty for a set of data
- 📊 To find the average, sum all the numbers and divide by the total count of numbers
- 📈 The uncertainty represents the range of likely values around the average
- ⏺ The uncertainty is calculated as half the range between the maximum and minimum values
- 🖊 Write the average plus or minus the uncertainty to summarize the data set
- 🔢 Apply the process to a data set of test scores to demonstrate the calculations
- ⚖️ Round the uncertainty to 1 significant figure for a concise summary
- 📒 The range from average minus uncertainty to average plus uncertainty should cover the data set
- 🏁 Use the concepts to calculate average velocity and uncertainty over 10 one-second intervals
- ✅ The final velocity range with uncertainty represents the data well, despite going slightly beyond the max
Q & A
What are the two main things we need to calculate given a data set?
-The two main things we need to calculate given a data set are the average (or mean) and the uncertainty in the average.
How do you calculate the average of a data set?
-To calculate the average, you take the sum of all the numbers and divide it by the total number of data points.
What does the uncertainty represent in relation to the average?
-The uncertainty represents half of the total range of the data set, which shows the variability of the data around the mean.
How do you calculate the uncertainty?
-To calculate uncertainty, first find the maximum and minimum values. Subtract them and divide by 2. This gives you the uncertainty value.
Why do we round the uncertainty to one significant figure?
-We round the uncertainty to one significant figure to simplify the result and because the uncertainty is just an estimate of the variability.
What was the average test score calculated in the example?
-The average test score calculated in the example was 87.
What was the uncertainty in the test score example?
-The uncertainty was ±10 after rounding to one significant figure.
What was the range of test scores using the average and uncertainty?
-Using the average of 87 and uncertainty of ±10, the range of test scores was 77 to 97.
What was the average velocity calculated in the second example?
-In the second example, the average velocity was calculated to be 49.6 m/s.
What was the uncertainty in the velocity measurements?
-The uncertainty in the velocity measurements was ±5 m/s after rounding.
Outlines
📝 Calculating Averages and Uncertainties for Test Scores
This paragraph explains how to calculate the average and uncertainty for a set of 8 test scores. It goes through the process of finding the sum, dividing by the number of scores to get the average (87), then calculates the uncertainty by finding the range (max 96 - min 77 = 19), dividing the range by 2 (9.5), and rounding to 10. It states the final average and uncertainty is 87 +/- 10.
⏩ Finding Averages and Uncertainties for Velocities
This paragraph calculates the average and uncertainty for 10 velocity measurements provided at 1 second intervals. It sums the velocities (496), divides by 10 to get the average (49.6), then calculates the uncertainty by finding the max (55) and min (46) to get the range (9), dividing by 2 (4.5) and rounding to 5. It states the final velocity is 49.6 +/- 5 and verifies this range includes all the values.
Mindmap
Keywords
💡Average
💡Uncertainty
💡Range
💡Significant Figure
💡Data Set
💡Test Scores
💡Velocity
💡Number Line
💡Upper Limit
💡Lower Limit
Highlights
Explains how to calculate the average and uncertainty for a data set
Gives a step-by-step worked example of calculating average and uncertainty
Sums the data set and divides by number of data points to get average
Explains visually how uncertainty relates to range around the average
Defines equations for uncertainty and shows calculation
Gives the final range with average and uncertainty for first example
Works through a second example problem with different data set
Sums and averages second data set
Calculates uncertainty for second data set
Rounds uncertainty to one significant figure
Gives final range with average and uncertainty for second example
Checks if range with uncertainty covers data set values
Notes that range represents the data relatively accurately
Explains it captures essence of data though not perfectly
Provides full worked examples for calculating average and uncertainty
Transcripts
Browse More Related Video
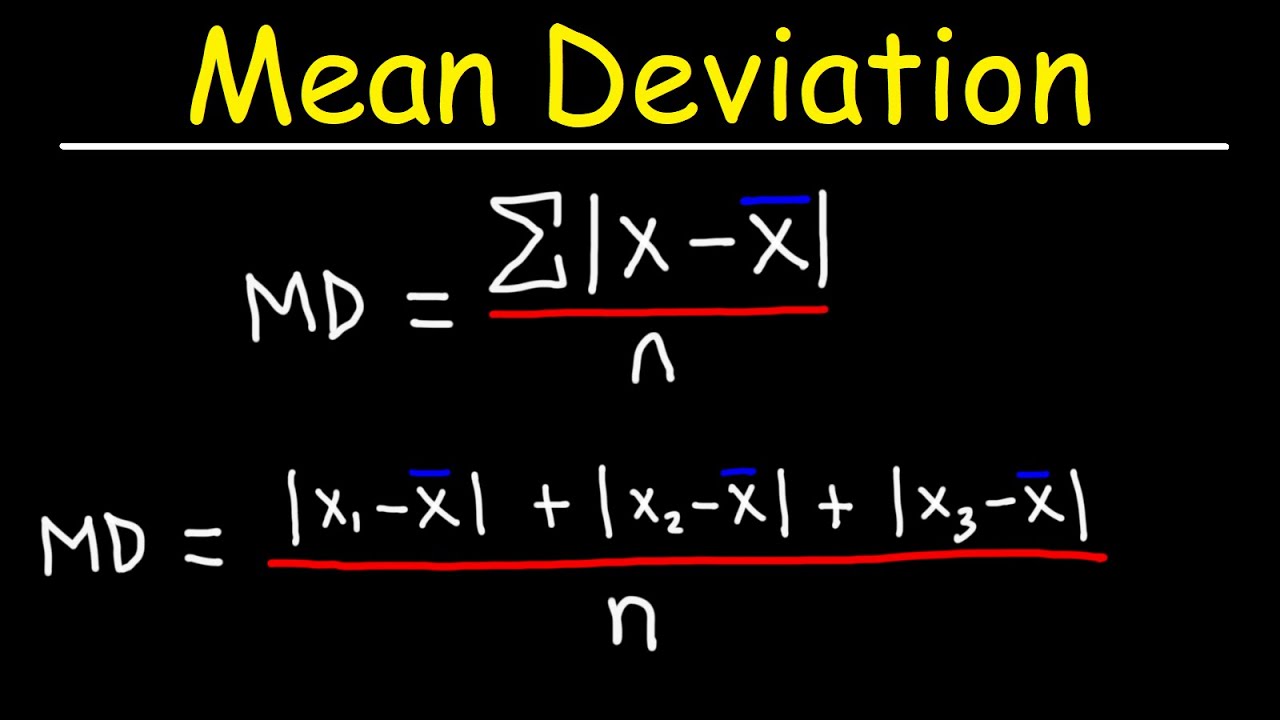
Mean Absolute Deviation - Statistics
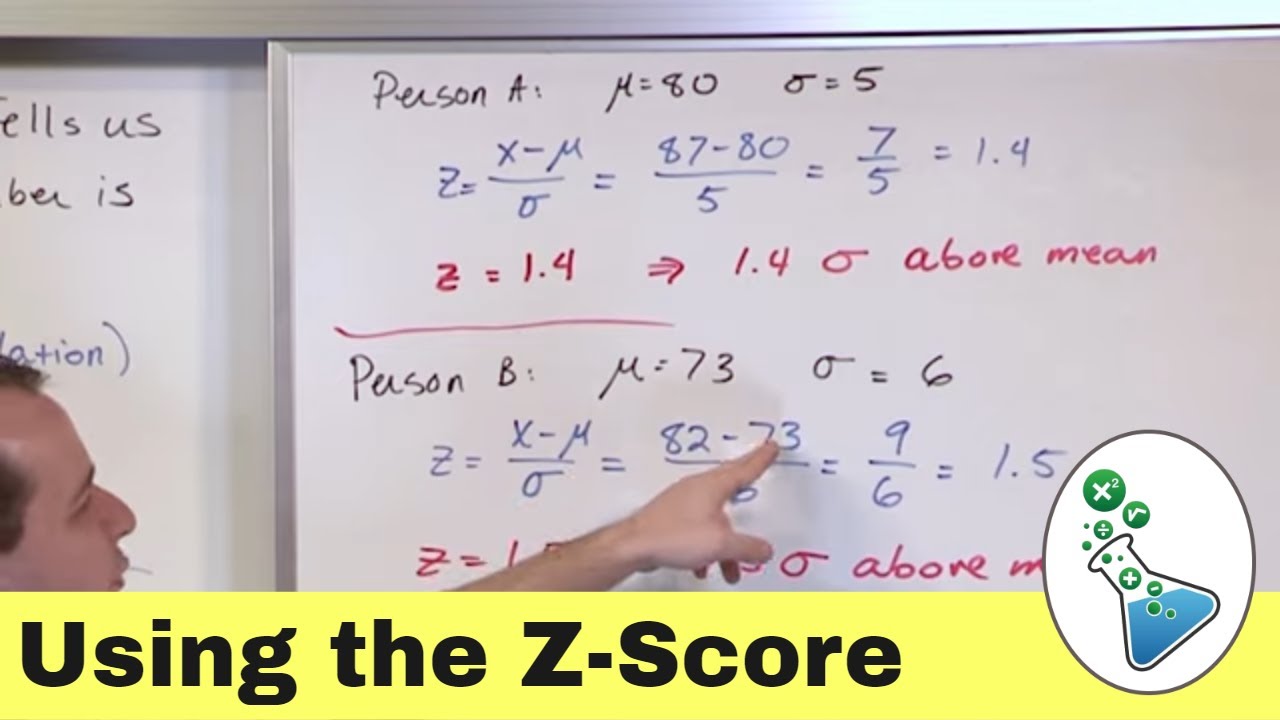
Intro to Standard Z-Score & Normal Distribution in Statistics
Analyzing Sets of Data: Range, Mean, Median, and Mode
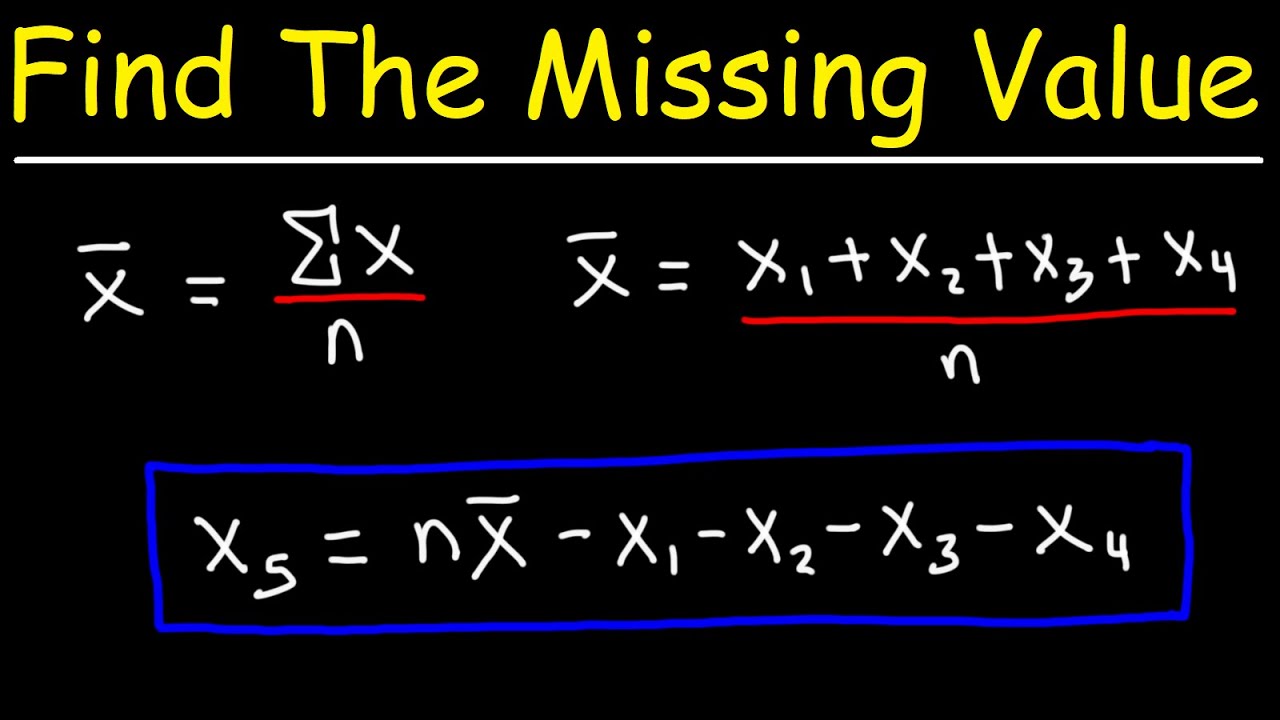
How To Find The Missing Value Given The Mean - Chemistry Test Scores and Statistics

Impact on median and mean when increasing highest value | 6th grade | Khan Academy

CH403 3 Experimental Error
5.0 / 5 (0 votes)
Thanks for rating: