Calculating the Mean, Variance and Standard Deviation, Clearly Explained!!!
TLDRIn this episode of StatQuest, host Josh Starmer delves into the fundamentals of statistics, focusing on estimating the mean, variance, and standard deviation. He explains the difference between calculating and estimating these parameters, emphasizing their importance in understanding data spread around the population mean. The video illustrates the process using mRNA transcript counts in liver cells as an example. Starmer clarifies that while the population mean and variance can be calculated with complete data, in practice, we often estimate these parameters from samples. He also highlights the distinction between using 'n' and 'n-1' in calculations, noting that dividing by 'n-1' corrects for using the sample mean instead of the population mean. The episode concludes with a reminder of the importance of estimating parameters when complete data is unavailable.
Takeaways
- 📚 The video is part of a series on statistics fundamentals focusing on estimating mean, variance, and standard deviation.
- 🔍 It assumes prior knowledge of histograms, statistical distributions, and the normal distribution.
- 🧬 The example used involves counting mRNA transcripts from gene X in liver cells, but could relate to any measurable quantity.
- 📊 To fit a normal curve to a histogram, one needs to calculate the population mean and standard deviation.
- 💡 The population mean is calculated by taking the average of all measurements in the population.
- 🔢 In practice, due to time and cost constraints, we often estimate the population mean using a sample mean (x-bar).
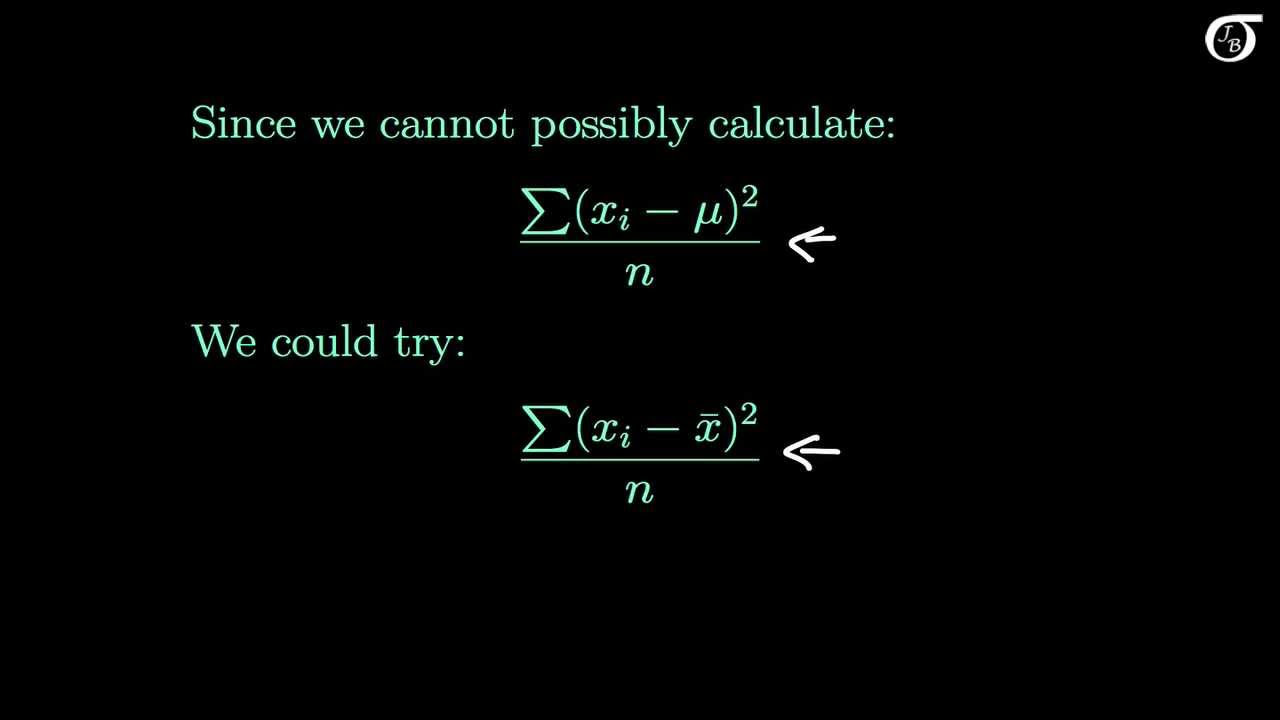
- ⚖️ The population variance is calculated by averaging the squared differences from the mean, but this is rarely done due to lack of full data.
- 📉 The standard deviation is derived from the variance by taking the square root, and it's used to measure the spread of the data.
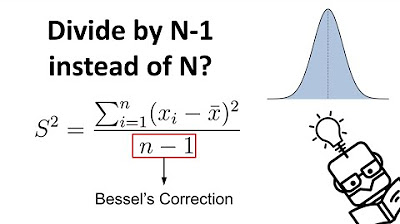
- 🔎 When estimating from a sample, the formula for variance includes dividing by n-1 (sample size minus one) to compensate for using the sample mean.
- 📈 The estimated standard deviation is crucial for understanding how data is spread around the population mean.
- 🛠️ Software like Microsoft Excel provides functions (VAR.P for population variance and VAR.S for sample variance), with VAR.S being the typical choice for estimating from a sample.
Q & A
What is the main topic of this StatQuest video?
-The main topic of this StatQuest video is estimating the mean, variance, and standard deviation in statistics.
What are the prerequisites for understanding the content of this video?
-The prerequisites for understanding this video are knowledge of histograms, statistical distributions, specifically the normal distribution, and understanding why we want to estimate population parameters.
What is an example given in the video to illustrate the concept of counting mRNA transcripts?
-An example given in the video is counting the number of green apples in five different grocery stores or green t-shirts in five different clothing stores as a way to understand the concept of counting mRNA transcripts in liver cells.
What is the formula used to calculate the population variance?
-The formula used to calculate the population variance is the sum of the squared differences between each measurement and the population mean (X - μ)^2, divided by the number of measurements (n).
Why is it necessary to square each term when calculating the population variance?
-Squaring each term ensures that each difference is positive, preventing negative differences from the left side of the mean from canceling out the positive differences from the right side of the mean.
What is the symbol commonly used by statisticians to refer to the estimated mean?
-The symbol commonly used by statisticians to refer to the estimated mean is x-bar.
What is the reason for dividing by n-1 instead of n when estimating the population variance?
-Dividing by n-1 compensates for the fact that we are calculating the differences from the sample mean instead of the population mean, which would otherwise consistently underestimate the variance around the population mean.
What is the estimated population variance calculated in the video using the sample data?
-The estimated population variance calculated in the video using the sample data is 100.1.8.
Why does the video emphasize the difference between calculating and estimating variance?
-The video emphasizes the difference because it has significant implications for the accuracy of the estimates, especially when using sample data instead of the entire population data.
What is the estimated standard deviation obtained in the video, and how is it derived?
-The estimated standard deviation obtained in the video is 10.1, which is derived by taking the square root of the estimated population variance.
Why does the video mention that Microsoft Excel does not estimate variance and standard deviation by default?
-The video mentions this to highlight that users often need to make a conscious choice between calculating population variance (VAR.P) and estimating it (VAR.S), and since most data sets are samples, VAR.S should be used almost always.
Outlines
📚 Introduction to Estimating Population Parameters
This paragraph introduces the topic of estimating population parameters such as mean, variance, and standard deviation in the context of statistics. The video, titled 'Stat Quest,' is hosted by Josh Stormer and builds upon the assumption that viewers are familiar with histograms, statistical distributions, and the normal distribution. It uses the example of counting mRNA transcripts in liver cells to illustrate the concept of estimating population parameters from a sample. The paragraph emphasizes the impracticality of measuring every single entity in a population, hence the necessity of estimation using samples. It also introduces the terminology of using 'x-bar' for the sample mean and 'mu' for the population mean, explaining how the sample mean can serve as an estimate for the population mean.
📉 Calculating Population Variance and Standard Deviation
This section delves into the specifics of calculating the population variance and standard deviation, which are key measures of the spread of data around the population mean. The process involves squaring the difference between each data point and the population mean, summing these squared differences, and then dividing by the total number of measurements (n) to find the variance. The paragraph highlights the importance of squaring differences to ensure positivity and the use of the sample mean (x-bar) when the population mean (mu) is unknown. It also explains the concept of standard deviation as the square root of variance, which allows for a more interpretable measure of spread in the original units of the data.
🔍 Estimating Population Parameters from a Sample
The final paragraph focuses on the practical aspect of estimating population parameters from a sample, as it is rare to have access to the entire population data. It explains the formula for estimating the population variance, which involves using the sample mean (x-bar) and dividing by n-1 instead of n. This adjustment (n-1) corrects for the bias that arises from estimating the variance based on a sample rather than the entire population. The estimated standard deviation is derived by taking the square root of the estimated variance. The paragraph concludes with a comparison of the estimated parameters to the true population parameters, demonstrating that even with a small sample size, the estimates can be reasonably accurate, thus saving time and resources.
Mindmap
Keywords
💡Standard Deviation
💡Histogram
💡Normal Distribution
💡Population Mean
💡Sample Mean (x-bar)
💡Variance
💡Population Variance
💡Population Standard Deviation
💡Estimated Population Variance
💡Estimated Population Standard Deviation
💡Microsoft Excel
Highlights
Introduction to estimating mean, variance, and standard deviation in statistics fundamentals.
Assumption of knowledge on histograms, statistical distributions, and the normal distribution.
Explanation of estimating population parameters if not already understood.
Example of counting mRNA transcripts in liver cells to illustrate statistical concepts.
The impracticality of measuring every single entity in a population due to time and cost.
How to calculate the population mean using all available measurements.
Clarification that the calculated mean with all measurements is the actual population mean, not an estimate.
The process of estimating the population mean using a sample mean (x-bar).
Differentiation between the symbols used for the sample mean (x-bar) and the population mean (mu).
Importance of calculating the population variance and standard deviation to understand data spread.
Formula and process for calculating the population variance.
The issue with units when calculating variance and the solution of using standard deviation.
Almost never having the full population data and the need to estimate variance and standard deviation.
The formula for estimating the population variance using a sample and the importance of dividing by n-1.
Explanation of why dividing by n-1 compensates for using the sample mean instead of the population mean.
Calculation of the estimated population variance and standard deviation using the sample data.
Graphical representation of the estimated population parameters on a histogram.
The impact of more data on the accuracy of estimated parameters and their confidence.
Summary of calculating versus estimating population mean, variance, and standard deviation.
Note on Microsoft Excel's functions for calculating population variance and the recommendation to use the estimate function.
Encouragement to subscribe for more educational content and information on supporting the channel.
Transcripts
Browse More Related Video
Sample variance | Descriptive statistics | Probability and Statistics | Khan Academy
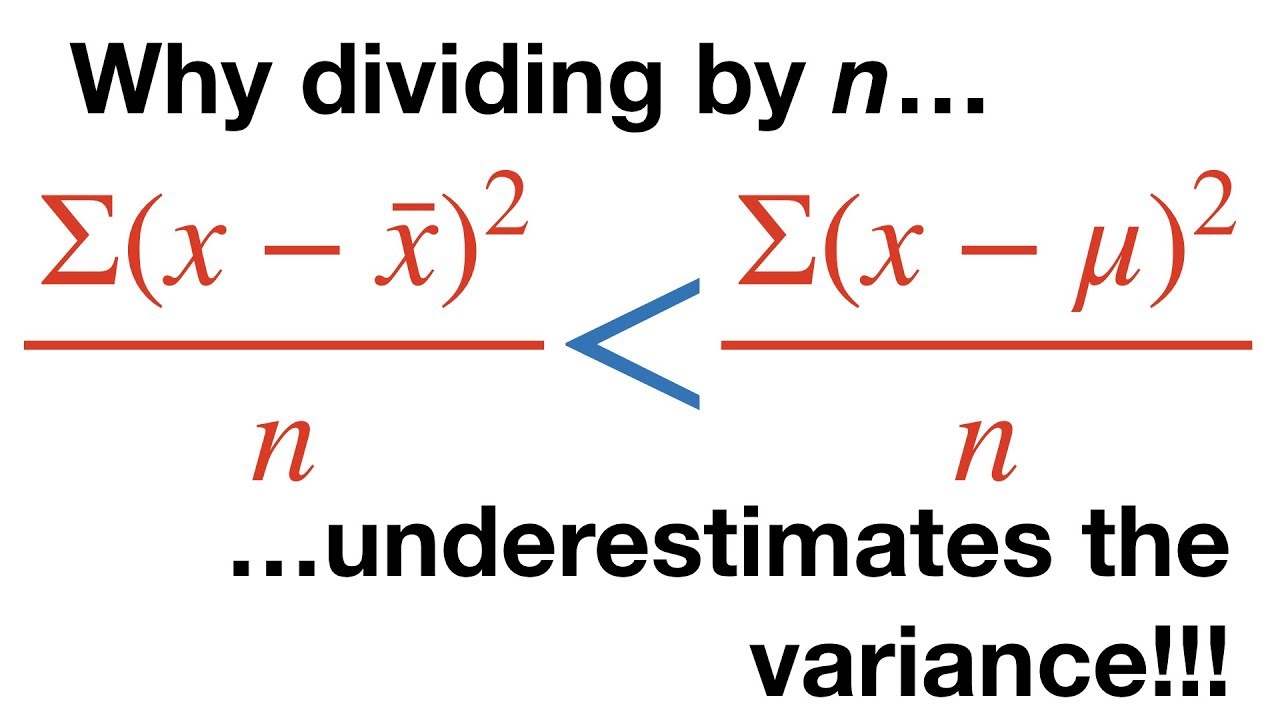
Why Dividing By N Underestimates the Variance
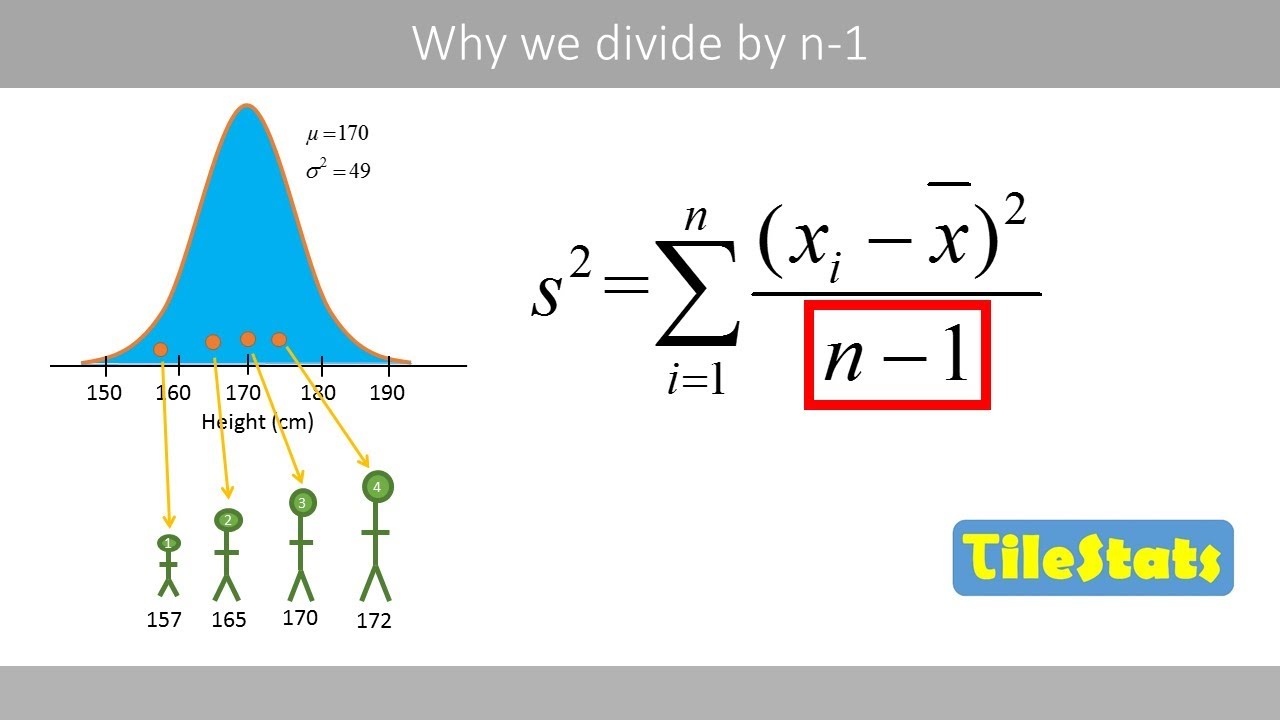
Why do we divide by n-1 and not n? | shown with a simple example | variance and sd
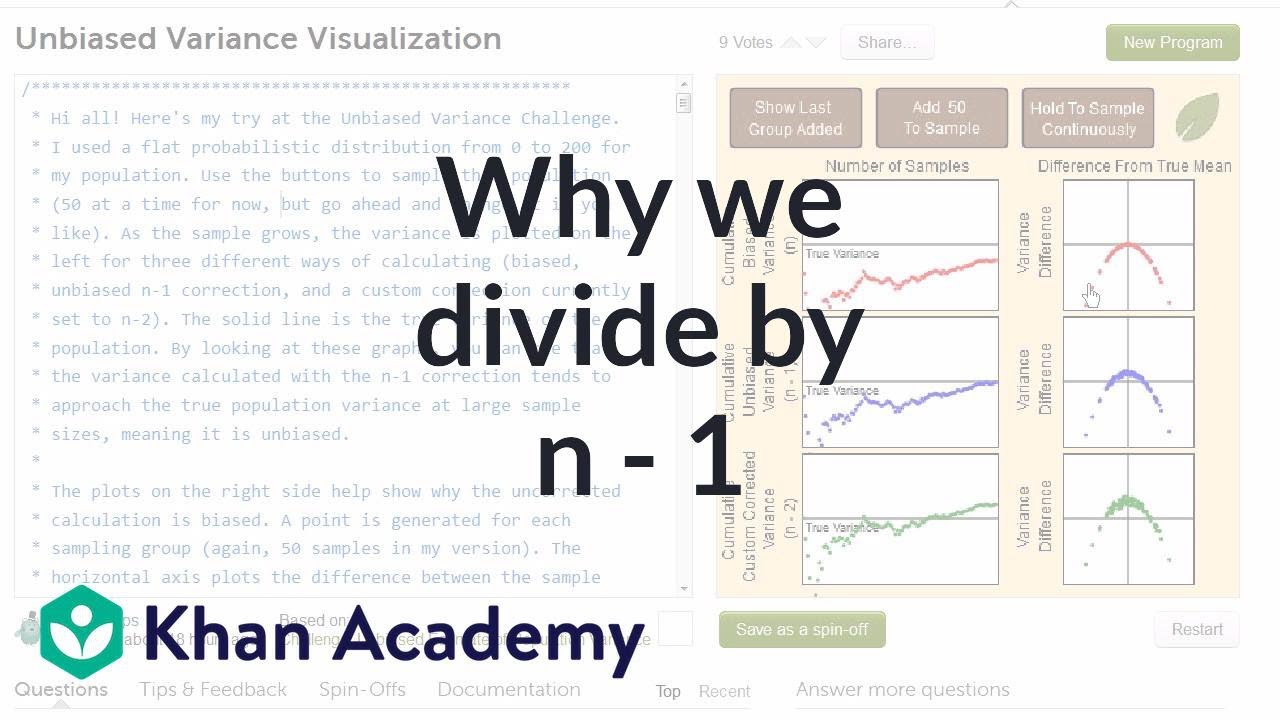
Another simulation giving evidence that (n-1) gives us an unbiased estimate of variance
Why We Divide by N-1 in the Sample Variance (Standard Deviation) Formula | The Bessel's Correction
The Sample Variance: Why Divide by n-1?
5.0 / 5 (0 votes)
Thanks for rating: