Contingency Table – Relative Risks – Epidemiology & Biostatistics | Lecturio
TLDRThe video script discusses the use of a contingency table to analyze the relationship between exposure to risk factors, such as smoking, and outcomes like lung cancer. It explains the importance of table setup, with exposure status on the horizontal axis and outcome status on the vertical axis. The script introduces key epidemiological concepts: absolute risk, which quantifies the probability of an outcome in a population; relative risk, comparing the absolute risks between exposed and unexposed groups; and attributable risk, which assesses the proportion of an outcome due to a specific behavior. The explanation is grounded in the context of smoking and lung cancer, providing a clear framework for understanding these risks and their implications for public health.
Takeaways
- 📊 A contingency table is essential for determining the relationship between exposure and outcomes, with exposure on the horizontal axis and outcomes on the vertical axis.
- 🚬 The population is categorized into four groups based on exposure (smoking) and outcomes (lung cancer): A (smokers without cancer), B (non-smokers with cancer), C (non-smokers without cancer), and D (smokers with cancer).
- 🔢 The total number of people in the study is denoted as 'n', with 'marginals' referring to the sums on the ends of the contingency table.
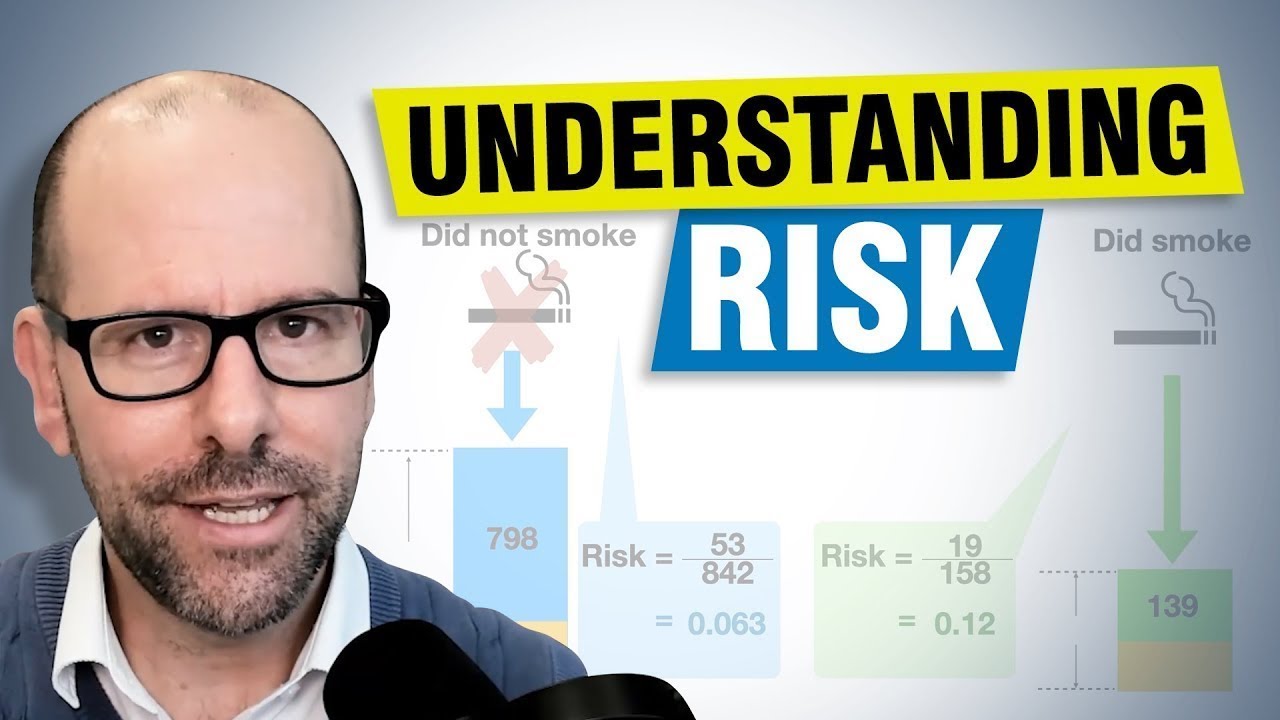
- 🎯 Absolute risk refers to the proportion of people who experience the outcome (e.g., getting lung cancer if you smoke).
- 🔄 Relative risk is the comparison of absolute risks between the exposed (smokers) and unexposed (non-smokers) groups.
- 🔍 Attributable risk assesses how much of the outcome (e.g., lung cancer) is due to the behavior of interest (smoking) rather than other factors.
- 📈 Cumulative incidence rate amongst the exposed is calculated as (number of smokers with cancer / all smokers).
- 📈 Absolute risk in the unexposed group is calculated as (number of non-smokers with cancer / all non-smokers).
- 📉 Absolute risk reduction measures the change in risk of the outcome (e.g., lung cancer) by not engaging in the exposure (e.g., not smoking).
- 🌟 The difference between the absolute risks in the exposed and unexposed groups indicates the health gain from avoiding the behavior (e.g., not smoking).
- 🎓 Understanding the setup of the contingency table and the calculation of these risks is crucial for accurate analysis and interpretation of health-related data.
Q & A
What is a contingency table in the context of the script?
-A contingency table is a statistical tool used to display the relationship between two categorical variables, such as exposure to a risk factor (like smoking) and an outcome (like lung cancer). It helps in determining the association between the variables.
Why is the setup of the contingency table important?
-The setup of the contingency table is crucial because it determines whether the subsequent statistical formulas will work correctly. The exposure status should be on the horizontal levels and the outcome status on the vertical components for accurate analysis.
What are the four categories in the contingency table based on smoking and lung cancer?
-Category A represents smokers who do not get lung cancer, Category B represents non-smokers who get lung cancer, Category C represents non-smokers who do not get lung cancer, and Category D represents the total number of people in the dataset.
What is absolute risk?
-Absolute risk refers to the proportion of people who experience a particular outcome, such as the risk of getting lung cancer if one is a smoker. It is calculated as the number of people with the outcome (e.g., lung cancer) divided by the total number of people in the exposed group (smokers).
How is relative risk calculated?
-Relative risk is calculated by comparing the absolute risk of getting the outcome in the exposed group (smokers) to the absolute risk of getting the outcome in the unexposed group (non-smokers). It shows the risk of the outcome when exposed versus the risk when not exposed.
What is attributable risk?
-Attributable risk is the portion of the outcome (like lung cancer) that can be attributed to a specific behavior or exposure (like smoking). It helps to understand how much of the outcome is due to the behavior of interest, excluding other factors.
What does the term 'marginals' refer to in the context of the contingency table?
-Marginals are the sums on the ends of the contingency table, representing the totals for each row (exposed and unexposed) and each column (outcome and no outcome). They are used to calculate absolute risks and other statistical measures.
How is absolute risk reduction defined?
-Absolute risk reduction is the difference in the risk of having the outcome (e.g., lung cancer) between the exposed group (smokers) and the unexposed group (non-smokers). It quantifies how much the risk changes by not engaging in the exposure (smoking).
What is the significance of understanding these risks and their calculations?
-Understanding these risks and their calculations is important for public health and medical research as it helps in assessing the impact of risk factors on health outcomes, informing prevention strategies, and making informed decisions about health behaviors.
Why might a non-smoker still get lung cancer?
-A non-smoker might get lung cancer due to other risk factors not accounted for in the script, such as exposure to secondhand smoke, radon gas, asbestos, or genetic predisposition. It illustrates that not all outcomes are solely determined by the primary risk factor under study.
How can the information from the contingency table be used in public health interventions?
-The information from the contingency table can be used to design targeted interventions aimed at reducing exposure to known risk factors, such as smoking cessation programs, and to educate the public about the risks associated with certain behaviors to improve overall health outcomes.
Outlines
📊 Understanding Contingency Tables and Risk Concepts
This paragraph introduces the concept of a contingency table, emphasizing its importance in determining the validity of the formulas to be used. It explains that the table should be set up with exposure status on the horizontal levels and outcome status on the vertical components. The paragraph also discusses the need to match the setup with that of textbooks for accurate results. It further delves into the categorization of individuals based on their exposure (smoking) and outcomes (lung cancer), identifying four categories: smokers without lung cancer, non-smokers with lung cancer, non-smokers without lung cancer, and smokers with lung cancer. The explanation of absolute risk, which is the probability of getting an outcome given exposure, and relative risk, which compares the absolute risks between exposed and unexposed groups, is provided. The paragraph also touches on attributable risk, which quantifies the portion of an outcome due to a specific behavior (smoking in this case). The summary concludes with a discussion on absolute risk reduction, which measures the change in outcome chances due to the absence of exposure (not smoking).
📝 Continuation and Further Explanation
This paragraph continues from the previous one, focusing on the calculation and interpretation of risks associated with exposure to certain behaviors, specifically smoking. It explains the concept of cumulative incidence rate, which is the risk of getting an outcome (like lung cancer) among those exposed (smokers) or unexposed (non-smokers). The paragraph also clarifies the difference between absolute risk in the exposed group and the unexposed group, providing a formula for each. The main point is to understand how the risk of an outcome changes with exposure and how much risk is reduced by not engaging in the exposure (not smoking). The explanation is concluded with a reiteration of the importance of these risk calculations in understanding the impact of behaviors on health outcomes.
Mindmap
Keywords
💡Contingency Table
💡Absolute Risk
💡Relative Risk
💡Attributable Risk
💡Absolute Risk Reduction
💡Incidence
💡Marginals
💡Risk Factor
💡Cumulative Incidence Rate
💡Health Behavior
💡Outcome
Highlights
Setting up a contingency table is crucial for determining the relationship between exposure and outcomes.
The contingency table should have exposure status on the horizontal levels and outcome status on the vertical components.
Textbooks may present the contingency table differently, so it's important to ensure consistency with the setup used in the lecture.
The population is categorized into four groups based on exposure and outcome: A, B, C, and D.
Absolute risk refers to the proportion of new cases encountered over time.
Incident cases represent new occurrences, whereas pre-existing conditions do not.
Relative risk is the comparison of the absolute risk of an outcome between the exposed and unexposed groups.
Attributable risk assesses how much of an outcome is due to a specific behavior or exposure.
Absolute risk in the exposed group is calculated as the number of people with the outcome who were exposed divided by the total number of exposed.
Absolute risk in the unexposed group is calculated as the number of people with the outcome who were not exposed divided by the total number of unexposed.
Cumulative incidence rate amongst the exposed is the sum of those with the outcome and exposed divided by the total number of exposed.
Cumulative incidence rate in the unexposed group is the sum of those with the outcome and not exposed divided by the total number of unexposed.
Absolute risk reduction measures the change in outcome chance by not engaging in the exposure behavior.
The difference between the absolute risks in the exposed and unexposed groups indicates the health gain from avoiding the behavior.
The contingency table and its formulas are essential for understanding and calculating risks associated with exposure to certain behaviors or factors.
Transcripts
Browse More Related Video


5.0 / 5 (0 votes)
Thanks for rating: