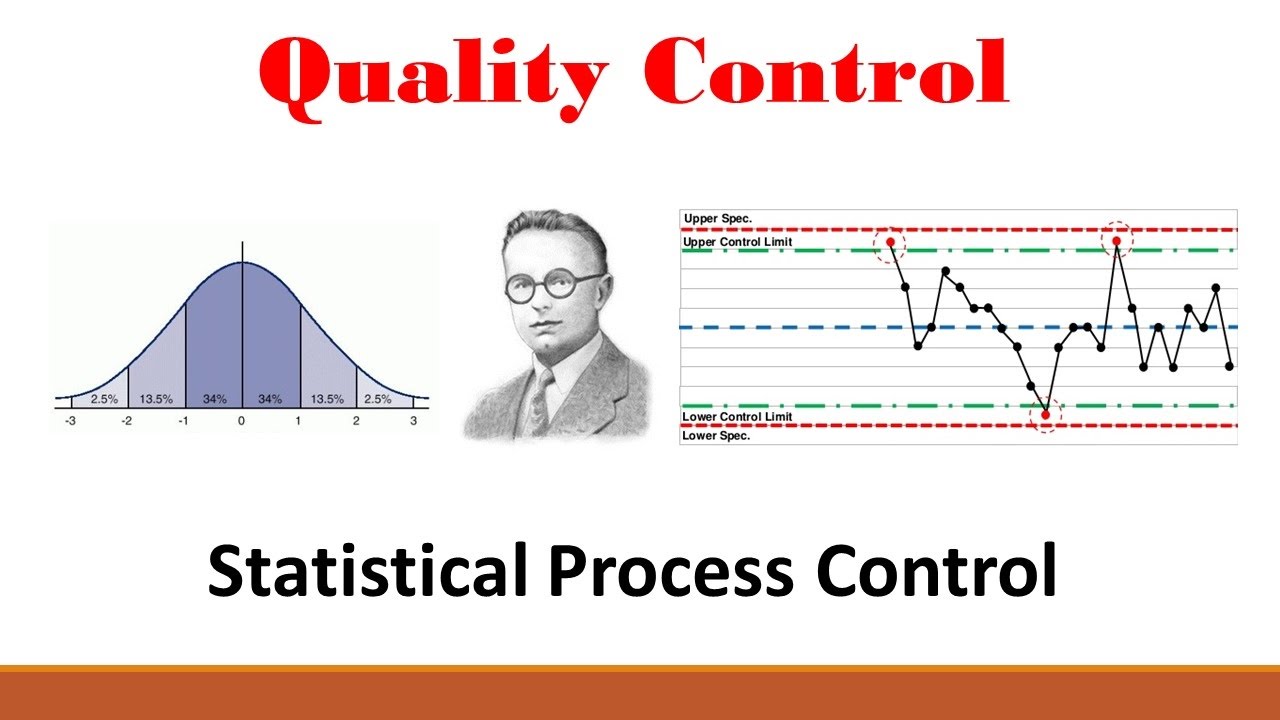
SPC Control Charting Rules
TLDRThis video from the Engineering Toolbox channel delves into the intricacies of control charting and statistical process control, focusing on the interpretation of control charts and the eight Nelson rules. It provides a historical background, starting with Walter Shewhart's introduction of control charts in the 1920s, through to the Western Electric standards and Nelson's additional rules in the 1980s. The video offers in-depth analysis of each rule, their purpose in detecting shifts and patterns, and practical advice on applying these rules effectively while considering the risk of false positives and resource management.
Takeaways
- 📊 The video discusses control charting and statistical process control, including how to interpret control charts and the eight control charting rules, known as the Nelson rules.
- 🔍 The eight rules help detect shifts and patterns in processes, where shifts indicate a change due to a special cause and patterns can be trends or sequences influenced by special causes.
- 👀 Visual analysis can identify potential shifts and patterns, but the Nelson rules provide a more statistically rigorous method to confirm these observations.
- 📚 The concept of control charts was introduced by Walter Shewhart in the 1920s, using three Sigma limits to detect large process shifts.
- 📈 Western Electric expanded on Shewhart's method in the 1950s by adding three additional rules to increase chart sensitivity for detecting smaller shifts.
- 🔧 Nelson's rules, introduced in the 1980s, include four additional rules for detecting certain patterns in the data, building upon the existing methods.
- 🚫 Rule number three is controversial because it may not detect signals faster than rule one, questioning its necessity in the analysis.
- 📉 Rule number four is useful for identifying mixtures or systemic over control, which can indicate issues with the process that need correction.
- ⚠️ Rule number seven can detect issues with subgrouping or sampling methods, which is crucial when setting up control charts to ensure accurate monitoring.
- 🔄 Rule number eight is for detecting mixture patterns, similar to rule number four, and should be used during the initial setup of control charts.
- 🛠️ The video emphasizes the importance of understanding control charting rules for effective process monitoring and improvement, warning against misuse that could lead to incorrect assumptions about the process.
Q & A
What is the main topic discussed in the video script?
-The main topic discussed in the video script is the interpretation of control charts and the eight control charting rules, known as the Nelson rules, used in statistical process control.
Who introduced the concept of control charts?
-The concept of control charts was introduced by Walter Shewhart in the 1920s.
What is the purpose of control charting rules?
-Control charting rules help detect two phenomena: shifts and patterns. Shifts occur when a special cause has made the process change, while patterns are arrangements of data influenced by a special cause, such as trends or sequences.
What is the significance of the three-sigma limits in control charts?
-The three-sigma limits are used to detect large process shifts. If any data points fall outside these limits, it indicates a special cause behind the shift with a high level of confidence.
What does Western Electric's second rule test for in control charts?
-Western Electric's second rule tests to see if two out of any three sequential points are greater than two sigma from the mean on the same side.
Why is Nelson's third rule controversial?
-Nelson's third rule is controversial because the likelihood of six points in a row falling between three sigma levels is very low, making it less effective in detecting signals any faster than rule one.
What does Nelson's fourth rule aim to detect?
-Nelson's fourth rule aims to detect a pattern that may indicate a mixture of two underlying processes in the same chart or systemic over control, which results in an oscillating pattern in the data.
Why should rule number one be the top priority to investigate and correct when signals are detected?
-Rule number one should be the top priority because it captures essentially all the large process shifts, indicating that the process is not stable and requires immediate attention.
What is the potential issue with using too many control charting rules?
-Using too many control charting rules increases the risk of false positives and the need for resources to analyze, investigate, and improve upon the signals detected, which may not be economical or manageable.
Why is it important to consider the distribution of data before control charting a process?
-It is important to consider the distribution of data before control charting a process to ensure that the data is close to normally distributed, as the probabilities for signals and false alarms for each rule were calculated under this assumption.
How can secondary charts like MR, R, and s charts be used in conjunction with the control charting rules?
-Secondary charts like MR, R, and s charts can be used to analyze short-term or within-subgroup variation, while X-bar and X charts analyze long-term or between-subgroup variation. This can help identify issues like machine degradation that may affect short-term consistency without impacting the between-subgroup variation.
Outlines
📊 Introduction to Control Charting and Statistical Process Control
The video script introduces the Engineering Toolbox channel and delves into the topic of control charting and statistical process control, building on the basics from a previous video. The focus is on interpreting control charts and the eight rules of control charting, known as the Nelson rules, which enhance chart sensitivity and detect shifts and patterns in processes. The script provides an example data set to illustrate potential shifts and patterns, emphasizing the statistical improbability of certain arrangements of data points under normal variation.
🔍 Deep Dive into Nelson's Eight Control Charting Rules
This section of the script provides a historical background on control charts, starting with Walter Shewhart's introduction of the concept in the 1920s and the use of three-sigma limits to detect large process shifts. It then discusses the Western Electric standard developed in the 1950s, which included additional rules for increased chart sensitivity. The script introduces Nelson's rules, which include tests for various patterns and shifts in data, such as nine data points in a row on the same side of the mean, six or more data points in a row increasing or decreasing, and 15 data points within one standard deviation from the mean. Each rule is designed to detect specific phenomena that would be statistically unlikely under normal process variation.
🛠️ Applying Nelson's Rules for Process Improvement
The script explains the practical application of Nelson's rules for detecting and analyzing process shifts and patterns. It emphasizes the importance of rule one in capturing large shifts and the diminishing returns and increased risk of false positives with additional rules. The discussion includes the use of rules for continuous data sets and the assumption of normal distribution. The script also highlights the importance of considering resources when deciding how many rules to employ and the potential for misuse of control charts leading to incorrect assumptions about the process. It concludes with an example of how secondary charts can provide additional insights into process variation.
Mindmap
Keywords
💡Control Charting
💡Statistical Process Control (SPC)
💡Shifts
💡Patterns
💡Nelson Rules
💡Western Electric Rules
💡Special Cause Variation
💡Three Sigma Limits
💡Subgroup Charts
💡False Positives
💡Mixture or Systemic Over Control
Highlights
Introduction to the concept of control charts and statistical process control.
Explanation of how to interpret control charts using the eight control charting rules, known as Nelson's rules.
Discussion on detecting shifts and patterns in processes using control charting rules.
The importance of shifts and patterns in identifying special causes of variation in processes.
Historical background on the development of control charts by Walter Shewhart in the 1920s.
Western Electric's contribution to control charting with additional rules for increased sensitivity in the 1950s.
Nelson's eight rules for detecting specific patterns and shifts in data.
Rule number one's role in detecting large shifts in the process.
Rule number two's use in increasing chart sensitivity to small but sustained process shifts.
Controversy surrounding rule number three and its effectiveness in detecting trends.
Rule number four's detection of mixture or systemic over control patterns.
Rule number five and six's function in identifying medium and small process shifts.
Rule number seven's detection of issues with sub-grouping or sampling methods.
Rule number eight's role in identifying mixture patterns from different underlying sub-processes.
The necessity of using control charting rules with caution due to the risk of false positives.
Consideration of resources when employing additional rules for analyzing signals.
The diminishing returns on sensitivity gained from each additional control charting rule.
Applicability of rules two through eight for analyzing continuous type datasets.
The assumption of normal distribution for the data set in control charting.
Use of rules one through four for secondary charts like MR, R, and s charts.
Practical example of using control charts to detect machine degradation in a shaft cutting process.
Emphasis on the importance of understanding control charting for effective process analysis and improvement.
Transcripts
Browse More Related Video
Introduction to Statistical Process Control Charts (Lean Six Sigma)
Statistical Process Control | SPC Control charts (IMR ) using Minitab 17 |

Attribute Data Control Chart Examples!! How to select/create the P, NP, C and U Charts
CONTROL CHART BASICS and the X-BAR AND R CHART +++++ EXAMPLE
XBar-R Control Charts
Quality (Part 1: Statistical Process Control)
5.0 / 5 (0 votes)
Thanks for rating: