Attribute Data Control Chart Examples!! How to select/create the P, NP, C and U Charts
TLDRIn this educational video, Andy Robertson from CQE Academy introduces attribute data control charts, essential for quality professionals and exam candidates. He explains the critical difference between 'defects' and 'defectives,' guiding viewers on selecting the appropriate control chart based on data type and sample size. Robertson covers four common charts: np, p, c, and u, demonstrating calculations and interpretations with practical examples. This comprehensive guide is designed to help viewers understand and apply control charts effectively in their quality management processes.
Takeaways
- 📊 The video discusses the importance of understanding attribute data control charts for quality control and exam preparation, such as the CQE, Green Belt, and Black Belt exams.
- 🔍 A crucial distinction is made between 'defects' and 'defectives', which affects the selection of appropriate control charts for a process.
- 💡 'Defective units' are entire units that fail to meet specifications, while 'defects' are undesirable conditions within a unit.
- 📈 The type of data being counted (defectives or defects) and the sample size (constant or variable) are key factors in choosing the right control chart.
- 📝 Four common control charts are covered: np chart, p chart, c chart, and u chart, each used under different conditions of data type and sample size.
- ⚖️ The np chart is used for trending defective units with a constant sample size, while the p chart is for defective units with a variable sample size.
- 📉 The c chart is appropriate for counting defects with a constant sample size, and the u chart is for defects with a variable sample size.
- 📚 The underlying probability distributions differ based on whether defectives or defects are being counted, affecting control limit calculations.
- 🔢 The script provides step-by-step examples of how to calculate the center of the process (np), the percent defectives (p bar), and the control limits for the np and p charts.
- 📋 The c chart calculation focuses on the average number of defects per subgroup (c bar), and the u chart requires calculating the average percent defects (u bar) and the average sample size (n bar).
- 📊 The video includes visual representations of the control charts to demonstrate how data points are plotted and how control limits are applied.
- 🔄 The control limits for p and u charts can be recalculated using individual subgroup sizes, allowing for more precise control limit adjustments based on sample size variability.
Q & A
What is the main topic of Andy Robertson's video?
-The main topic of Andy Robertson's video is attribute data control charts, which are essential for those implementing control charts or preparing for quality exams like the CQE, Green Belt, or Black Belt.
What is the significance of distinguishing between defects and defectives in control charts?
-The distinction between defects and defectives is significant because it affects the choice of control charts used and the underlying probability distribution that forms the foundation of control limits.
What is the difference between a defective unit and a defect?
-A defective unit is an entire unit that fails to meet specifications, while a defect is an undesirable condition within a unit. A single defective unit can have multiple defects.
Which control charts are discussed in the video?
-The video discusses four common control charts: the np chart, the p chart, the c chart, and the u chart.
What is the np chart used for?
-The np chart is used for trending a count of defective units with a constant sample size.
How is the center line of an np chart calculated?
-The center line of an np chart, represented by np, is calculated by taking the average number of defective items per subgroup.
What are the two variables needed to calculate control limits for a p chart?
-The two variables needed to calculate control limits for a p chart are p bar, the average percent defective, and n bar, the average sample size.
Why is the c chart used instead of the np chart when dealing with defects?
-The c chart is used when dealing with defects because it accounts for the possibility of multiple defects within a single unit, which is based on the Poisson distribution rather than the binomial distribution used for defective units.
What does the u chart represent when analyzing defects with a variable sample size?
-The u chart represents the average percent defects per subgroup and allows for the calculation of control limits based on both the average percent defects and the average number of samples per subgroup.
How can the control limits on a p chart be adjusted for each subgroup?
-The control limits on a p chart can be recalculated using the individual subgroup sizes, allowing for unique control limits that change as the sample size fluctuates.
What should be done if the lower control limit calculation results in a negative number?
-If the lower control limit calculation results in a negative number, it should be rounded up to zero, as it is not possible to have a negative number of defects.
Outlines
📈 Introduction to Attribute Data Control Charts
Andy Robertson from CQE Academy introduces the concept of attribute data control charts, which are essential for those preparing for quality control exams or for practical application in the field. The video will cover the distinction between defects and defectives, which is crucial for selecting the appropriate control chart. The agenda includes understanding the difference, choosing the right control chart based on sample size and type of data, and an overview of the four most common control charts: the np, p, c, and u charts.
🔍 Understanding Defects vs. Defectives
The video delves into the critical difference between defects and defectives. A defective unit is an entire unit that fails to meet specifications, whereas a defect is an undesirable condition within a unit. The example of a car door with multiple defects illustrates how a single unit can have multiple defects, thus being considered a defective unit. This distinction is important as it affects the choice of control chart and the underlying probability distribution, either binomial for defectives or Poisson for defects.
📊 Control Charts for Defectives: np and p Charts
The video explains the use of np and p charts for tracking defective units with constant and variable sample sizes, respectively. The np chart is used when the sample size is constant, and the p chart is for variable sample sizes. The calculations for the center line (np or p bar) and control limits are demonstrated using an example dataset. The process's stability and control are assessed by plotting the number of defective units per subgroup against the control limits.
📚 Control Charts for Defects: c and u Charts
The video continues with an explanation of c and u charts, which are used for tracking defects with constant and variable sample sizes, respectively. The c chart is straightforward, requiring only the calculation of c bar, the average number of defects per subgroup. The u chart, similar to the p chart, requires calculations for u bar and n bar to determine control limits. The video demonstrates how to calculate these parameters using a dataset and how to plot the percent defects per subgroup on the u chart to assess process stability.
🎓 Conclusion and Call to Action
The video concludes with a summary of the key points covered and a call to action for viewers. Andy encourages viewers to like the video and subscribe to the channel for more content on becoming a Certified Quality Engineer (CQE). The video aims to equip viewers with the knowledge needed to excel in their quality control roles or exams.
Mindmap
Keywords
💡Attribute Data Control Charts
💡Defects vs. Defectives
💡Control Chart
💡np Chart
💡p Chart
💡c Chart
💡u Chart
💡Binomial Distribution
💡Poisson Distribution
💡Sample Size
💡Control Limits
Highlights
Introduction to Attribute Data Control Charts, essential for quality control and exam preparation.
The critical distinction between 'defects' and 'defectives' and its impact on control chart selection.
Explanation of how a defective unit is defined and its role in quality control processes.
The concept of a defect as an undesirable condition within a unit, using the car door example.
Importance of the defects versus defectives distinction in selecting control charts for quality control.
Overview of the four most common control charts: np, p, c, and u charts.
Detailed explanation of when to use np and p charts based on sample size constancy.
Calculation of control limits for np and p charts using np and p bar parameters.
Example of calculating np and p bar for an np chart with constant sample size.
Graphical representation of an np chart to visualize process stability and control.
Transition to variable sample size and the use of p charts for defective items.
Calculation of p bar and n bar for p charts and their role in determining control limits.
Demonstration of how control limits on a p chart can be recalculated for each subgroup size.
Introduction to c charts for counting defects with a constant sample size.
Procedure for calculating c bar and using it to determine control limits for c charts.
Illustration of a c chart to show the average number of defects per subgroup.
Discussion on u charts for variable sample sizes and their calculation using u bar and n bar.
Flexibility of u charts to recalculate control limits based on actual sample sizes.
Final summary of the lecture and the importance of understanding control charts for quality assurance.
Transcripts
Browse More Related Video
CONTROL CHART BASICS and the X-BAR AND R CHART +++++ EXAMPLE

The 7 Quality Control (QC) Tools Explained with an Example!
Introduction to Statistical Process Control Charts (Lean Six Sigma)

PROCESS CAPABILITY: Explaining Cp, Cpk, Pp, Ppk and HOW TO INTERPRET THOSE RESULTS
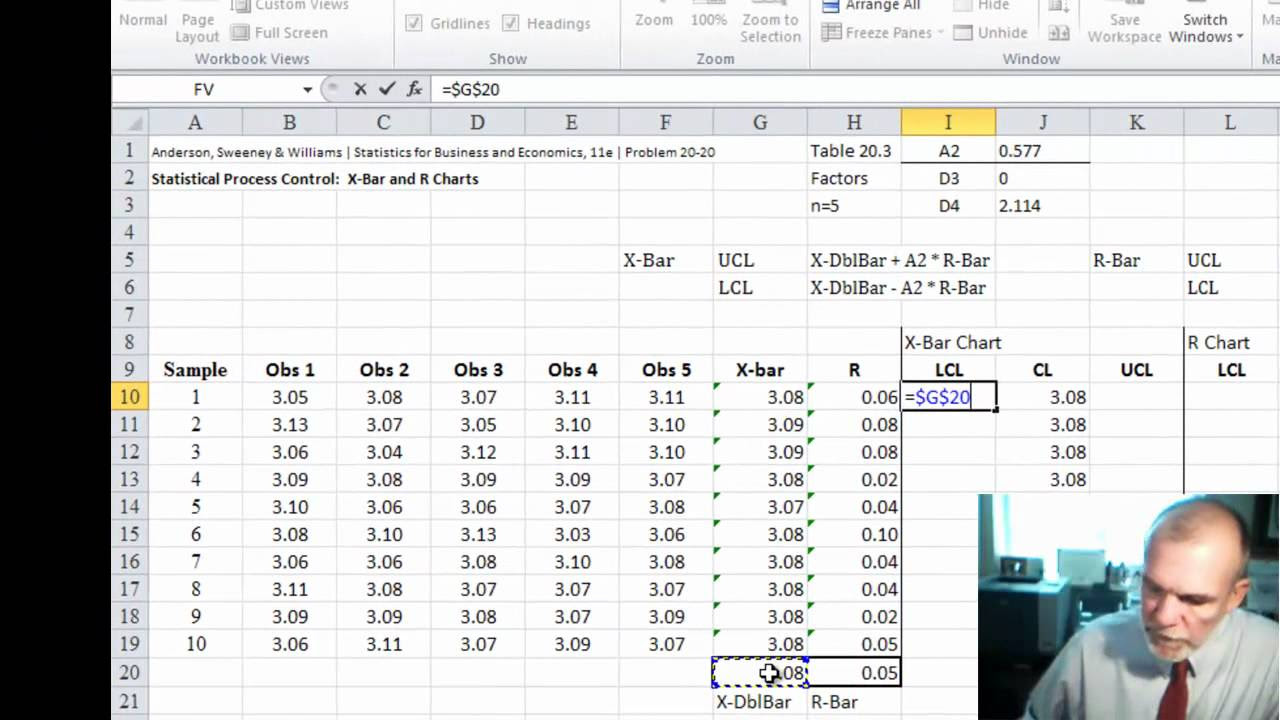
XBar-R Control Charts
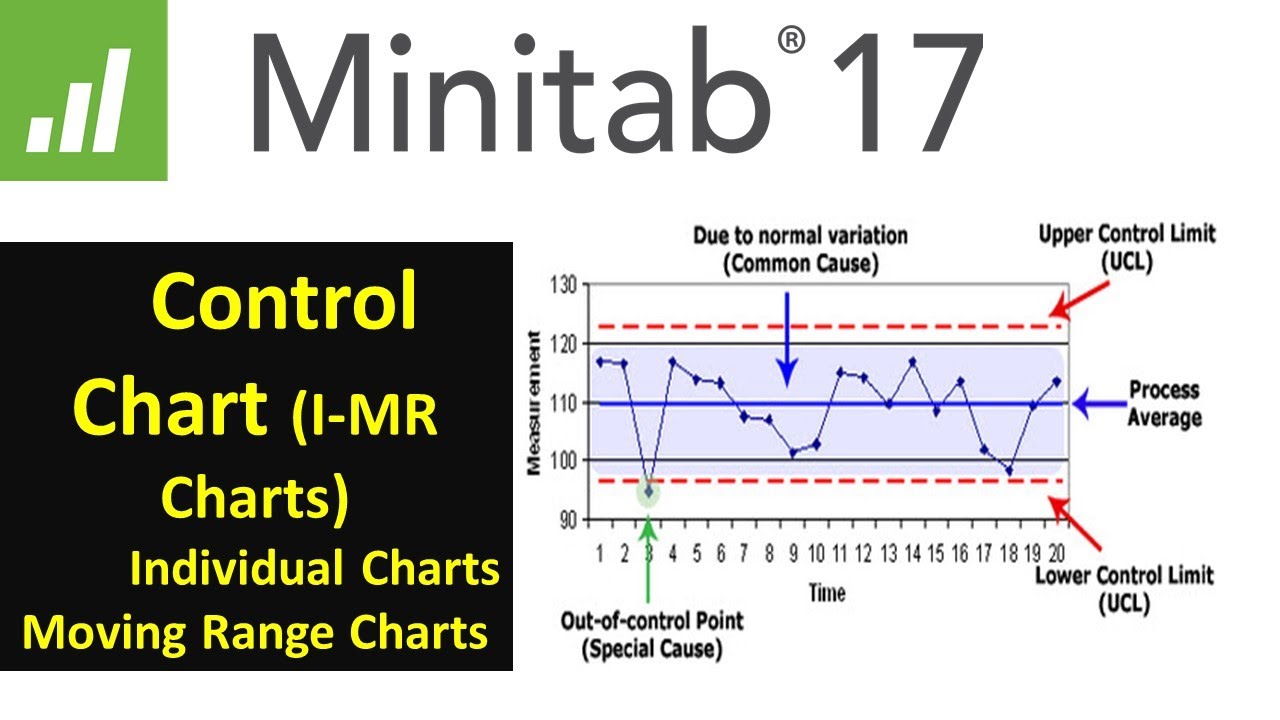
Statistical Process Control | SPC Control charts (IMR ) using Minitab 17 |
5.0 / 5 (0 votes)
Thanks for rating: