Empirical Rule 68-95-99.7 Rule to Find Percentile
TLDRThis video script introduces the empirical rule, also known as the 68-95-99.7% rule, to determine percentiles in a normal distribution. Using the example of house prices in a town with a mean of $180,000 and a standard deviation of $2,100, the script guides viewers through calculating the percentiles corresponding to one, two, and three standard deviations from the mean. It explains how to visualize the data on a bell curve and find the area under the curve to determine percentiles such as the 2.75th, 84th, and 16th, emphasizing that the mean represents the 50th percentile.
Takeaways
- 📚 The video discusses the empirical rule, also known as the 68-95-99.7% rule, which is used to find percentiles in a normal distribution.
- 🏠 The example provided uses house prices in a certain town with a mean price of $180,000 and a standard deviation of $2,100.
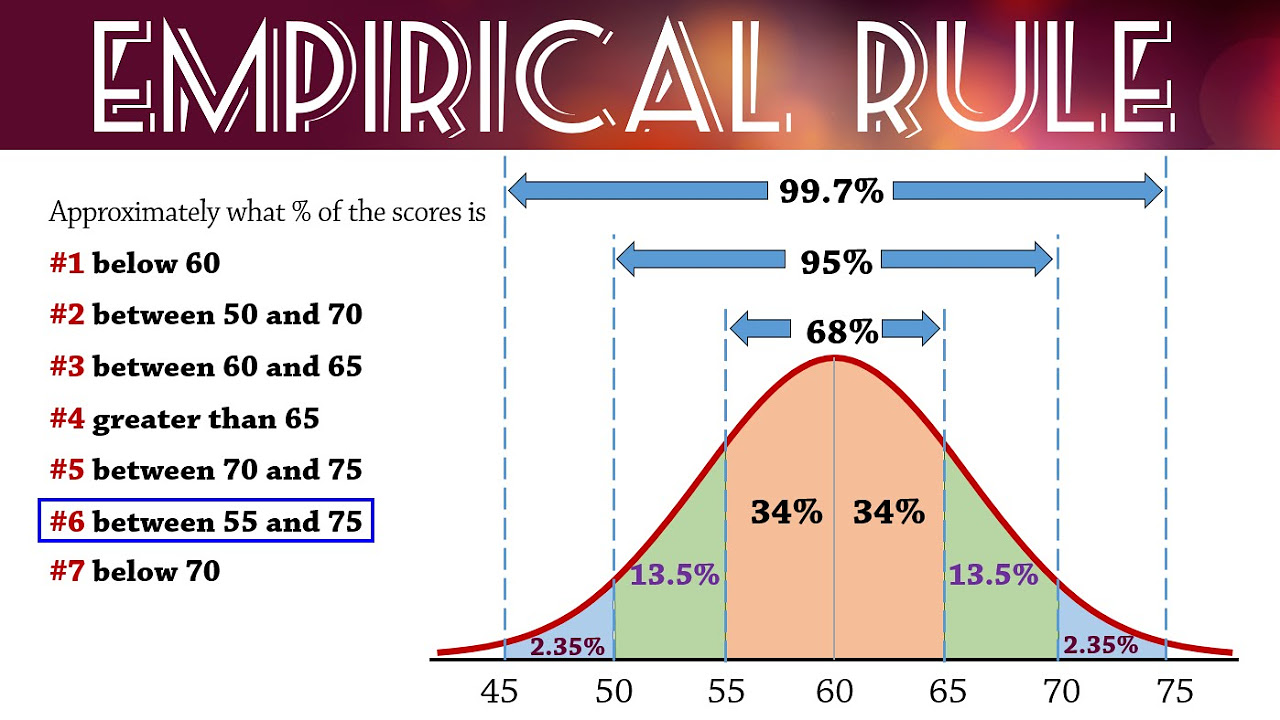
- 📊 The empirical rule is applied to a normal (bell-shaped) curve, where the mean is centered and standard deviations are marked.
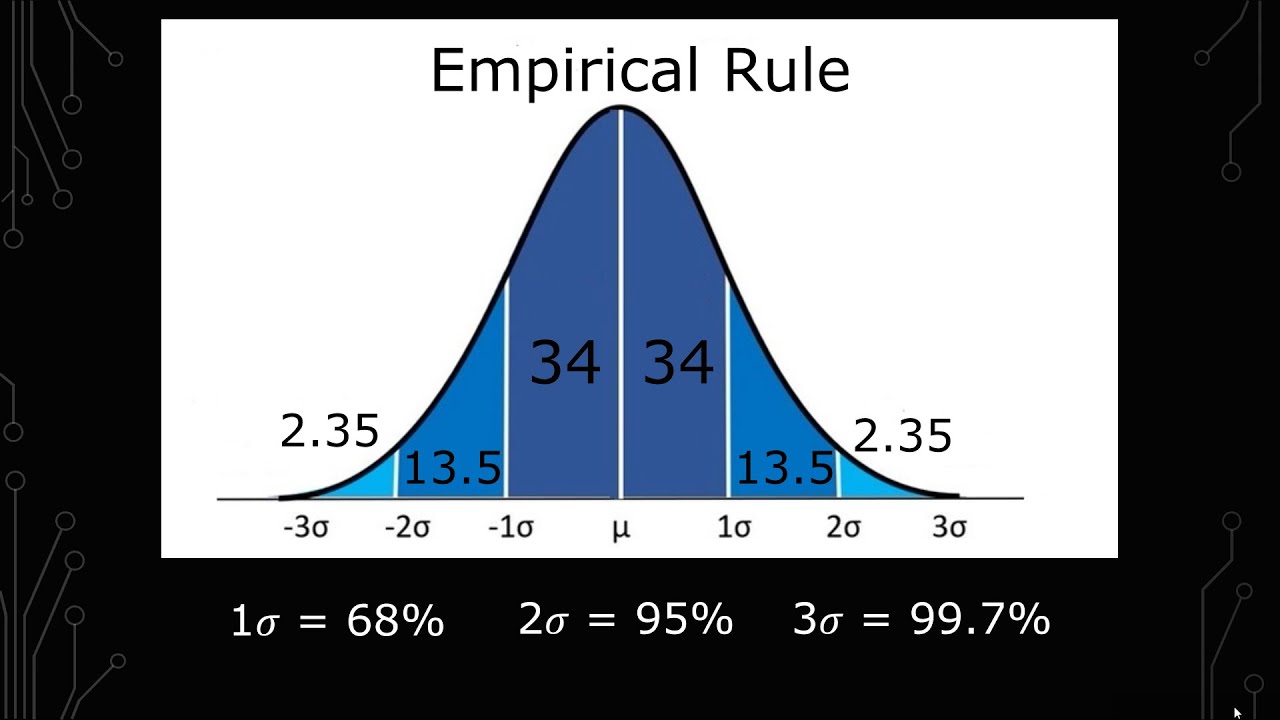
- 🔢 68% of data falls within one standard deviation of the mean, 95% within two, and 99.7% within three standard deviations.
- 📉 The script explains how to calculate percentiles by determining the area under the normal curve up to a certain value.
- 📈 To find the percentile for a value, one must understand the proportion of the total area (100%) that falls below that value.
- 🧩 The script breaks down the process of finding specific percentiles, such as the 2.75th, 84th, and 16th percentiles using the empirical rule.
- ✂️ The video script uses a simplified scale for demonstration purposes, converting large numbers to smaller, more manageable figures.
- 📝 It's important to note that the mean (mu) represents the 50th percentile, where half of the data values fall below and above it.
- 📌 The video emphasizes that all data values (100%) must fall under the curve, and the empirical rule helps to determine where specific values lie within that curve.
- 🤔 The script encourages viewers to ask questions if they have any, indicating an openness to further discussion and clarification.
Q & A
What is the empirical rule, also known as the 68-95-99.7% rule, used for?
-The empirical rule is used to estimate the percentage of data that falls within a certain range of standard deviations from the mean in a normal distribution.
What is the significance of the mean and standard deviation in the context of the empirical rule?
-The mean represents the central value of the data set, and the standard deviation measures the dispersion of the data. These are essential for determining the percentiles using the empirical rule.
How does the empirical rule relate to the normal distribution curve?
-The empirical rule is applied to the normal distribution curve, which is a bell-shaped curve, to find the percentage of data within one, two, or three standard deviations from the mean.
What percentage of data is expected to fall within one standard deviation of the mean according to the empirical rule?
-According to the empirical rule, approximately 68% of the data falls within one standard deviation of the mean.
How much of the data is expected to fall within two standard deviations of the mean?
-The empirical rule states that about 95% of the data falls within two standard deviations of the mean.
What is the percentage of data that falls within three standard deviations of the mean?
-According to the empirical rule, almost all of the data, 99.7%, falls within three standard deviations of the mean.
What is the significance of the 50th percentile in the context of the normal distribution curve?
-The 50th percentile represents the median of the data set, which is the mean in a normal distribution, and it divides the data into two equal halves.
How can you find the percentile for a value that is one standard deviation above the mean?
-To find the percentile for a value one standard deviation above the mean, you would calculate the area under the curve to the left of that value, which would be 50% plus half of the area between the mean and one standard deviation (34%), resulting in the 84th percentile.
What is the percentile for a value that is two standard deviations below the mean?
-The percentile for a value two standard deviations below the mean is calculated by taking the 50th percentile (50%) and subtracting half of the area between one and two standard deviations (34%), which gives the 16th percentile.
How do you calculate the percentile for a value that is two standard deviations above the mean?
-To find the percentile for a value two standard deviations above the mean, you would calculate the remaining area under the curve to the right of that value, which is 100% minus the area within two standard deviations (95%), then take half of that remaining area (2.5%), resulting in the 97.5th percentile.
What is the importance of understanding that 100% of data values fall under the normal distribution curve?
-Understanding that 100% of data values fall under the normal distribution curve is crucial because it ensures that all possible values are accounted for when using the empirical rule to find percentiles.
Outlines
📊 Introduction to the Empirical Rule
The video introduces the empirical rule, also known as the 68-95-99.7% rule, to find percentiles. It explains that a percentile represents the percentage of values falling below a specific point. The example used is a town with a mean house price of $180,000 and a standard deviation of $2,100. The video emphasizes the importance of understanding and drawing a normal curve or bell-shaped curve when using the empirical rule.
📈 Drawing and Labeling the Normal Curve
The video demonstrates how to draw a normal curve centered at the mean of $180,000 (represented as 180 for simplicity) and labels one, two, and three standard deviations above and below the mean. The labeled values are calculated as 182.1, 184.2, 186.3 above the mean, and 177.9, 175.8, 173.7 below the mean. It emphasizes labeling the curve accurately to understand the data distribution.
📐 Calculating Percentiles Using the Empirical Rule
The video explains how to calculate the percentiles for the values 175.8, 182.1, and 177.9. For 175.8, it demonstrates that 2.5% of the data falls below this value, making it the 2.5th percentile. For 182.1, it shows that 84% of the data falls below this value, making it the 84th percentile. For 177.9, it calculates that 16% of the data falls below this value, making it the 16th percentile. The explanation includes using the empirical rule's percentages and basic arithmetic to find these values.
📉 Understanding the Empirical Rule and Final Thoughts
The video recaps the key points of the empirical rule: 68% of data falls within one standard deviation, 95% within two, and 99.7% within three standard deviations. It reinforces that 100% of data falls under the curve and that the mean represents the 50th percentile. The video concludes by encouraging viewers to ask questions if they have any and thanks them for watching.
Mindmap
Keywords
💡Empirical Rule
💡Percentile
💡Mean
💡Standard Deviation
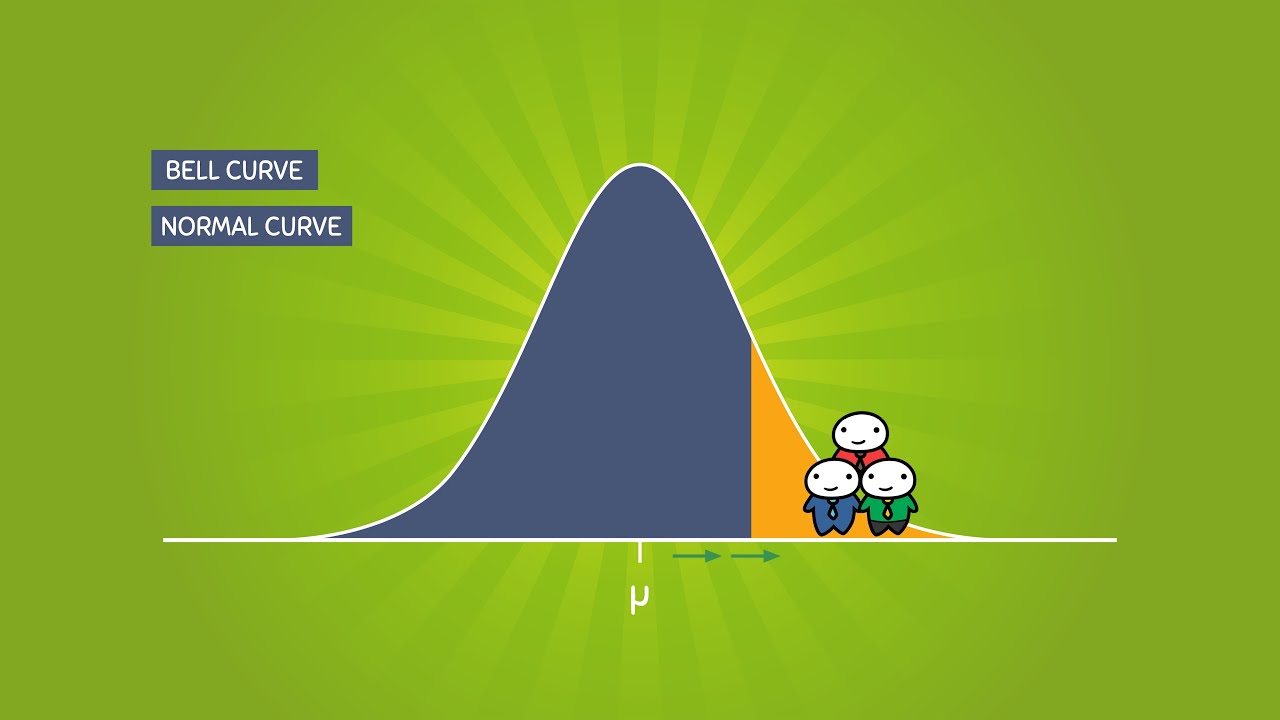
💡Normal Curve
💡Bell Shaped Curve
💡Deviation
💡Area Under the Curve
💡50th Percentile
💡Data Values
💡Percentile Rank
Highlights
Introduction to the empirical rule, also known as the 68-95-99.7% rule, for finding percentiles.
Definition of percentile and its relation to the distribution of values.
Presentation of a town's mean house price and standard deviation as key data.
Explanation of mu (mean) and sigma (standard deviation) in the context of the problem.
Illustration of the normal curve and its significance in the empirical rule.
Visual representation of the normal curve centered at the mean.
Description of how to calculate areas under the curve for the 68-95-99.7% rule.
Calculation of the percentile for values within one standard deviation from the mean.
Explanation of how 95% of the data falls within two standard deviations.
Understanding that 99.7% of the data is within three standard deviations.
Emphasis on the fact that 100% of data values must fall under the curve.
Method to find percentiles by identifying areas under the curve.
Conversion of house prices to a smaller scale for easier calculation.
Labeling of key values corresponding to one, two, and three standard deviations.
Determination of the 2.75th percentile using the empirical rule.
Calculation of the 84th percentile for a value within the normal distribution.
Finding the 16th percentile by considering the area to the left of a certain value.
Summary of the empirical rule's application to determine percentiles within a normal distribution.
Invitation for viewers to ask questions if they have any.
Transcripts
Browse More Related Video

Elementary Statistics - Chapter 6 Normal Probability Distributions Part 1
Empirical Rule (68-95-99.7) for Normal Distributions

Empirical Rule of Standard Deviation in Statistics
Applying the empirical rule to an example that uses an interval that is not symmetric
The Normal Distribution and the 68-95-99.7 Rule (5.2)
How to Use the Empirical Rule with Examples
5.0 / 5 (0 votes)
Thanks for rating: