PV-diagrams and expansion work | Thermodynamics | Physics | Khan Academy
TLDRIn this video, we explored how a system performs work by expanding, using a piston and pebbles. By removing pebbles incrementally, we maintained quasi-static processes, ensuring equilibrium and defined macrostates. The work done by the system was calculated as pressure times the change in volume, illustrated through a PV-diagram. We also discussed the significance of the area under the curve in determining work done and introduced the concept of net work in cyclic processes. Finally, we highlighted the importance of state functions like internal energy, which remains unchanged if the system returns to its initial state.
Takeaways
- 🔧 The script explains how a system does work through expansion, using the example of a movable ceiling and a piston with pebbles to illustrate the concept.
- 📐 It introduces the formula for work done by a system as pressure times the change in volume, which can be rewritten in terms of the area under a pressure-volume curve.
- 🔄 The concept of a quasi-static process is emphasized, where changes are made in very small increments to maintain equilibrium and constant pressure during the process.
- 📉 The script uses a PV-diagram to visualize the process, explaining that the area under the curve represents the work done by the system during expansion.
- 🔠 The difference between work done by the system (when volume increases) and work done to the system (when volume decreases) is clarified, relating it to the direction of the process on the PV-diagram.
- 🔍 The importance of the path taken in a process is highlighted, showing how different paths can result in different amounts of work done, even if the initial and final states are the same.
- 🔁 The script discusses the net work done by a system when it undergoes a cycle, indicating that the area inside a closed loop on a PV-diagram represents the net work.
- 🔴 The internal energy of a system is presented as a state function, meaning it depends only on the initial and final states, not on the path taken, and remains unchanged in a cycle.
- 📚 The script hints at the relevance of calculus for computing areas under curves in PV-diagrams, which is essential for determining the exact amount of work done.
- 📈 The concept of state variables, such as pressure and volume, is reiterated, noting that they are well-defined macrostates that can be used to describe the system's state at any point during a process.
- 🚫 The script cautions that the assumption of constant pressure during a process is only valid for very small changes in volume, and that for larger changes, the pressure will vary.
Q & A
What is the concept of work done by a system in the context of the video?
-In the video, work done by a system is explained as the force applied on a piston due to pressure, which is then multiplied by the distance the piston is pushed, resulting in the work done by the system through expansion or compression.
How is pressure related to force and area in the script?
-Pressure is defined as force per unit area. In the script, the force applied on the piston is calculated by multiplying the pressure by the area of the piston.
What is the significance of the formula 'pressure times change in volume' in the script?
-The formula 'pressure times change in volume' is used to express the work done by a system in a quasi-static process where the pressure is assumed to be roughly constant over small increments of volume change.
Why is the internal energy formula written with a negative sign in the script?
-The negative sign in the internal energy formula indicates that when work is done by the system, energy is being transferred to the surroundings, thus reducing the system's internal energy.
What does a quasi-static process imply in the context of the video?
-A quasi-static process implies a process that happens in very small increments, allowing the system to remain close to equilibrium at every point, with well-defined macrostates such as pressure and volume.
How is the PV-diagram used in the script to explain thermodynamic processes?
-The PV-diagram is used to visualize the relationship between pressure and volume during a thermodynamic process. It helps to illustrate the work done by the system as the area under the curve representing the process path on the diagram.
What is the difference between work done by the system and work done to the system as explained in the script?
-Work done by the system refers to the energy transferred out of the system due to expansion, represented by the area under the curve on a PV-diagram during an expansion process. Work done to the system refers to the energy transferred into the system due to compression, represented by the area under the curve during a compression process.
How does the script explain the concept of a reversible process in relation to quasi-static processes?
-While the script does not explicitly define a reversible process, it implies that a quasi-static process can be considered reversible if it maintains equilibrium at all times, allowing the system to return to its initial state without energy loss.
What is the significance of the area inside a closed loop on a PV-diagram as per the script?
-The area inside a closed loop on a PV-diagram represents the net work done by the system during a cycle that returns it to its initial state. This area is important for understanding the total energy exchange during a complete thermodynamic cycle.
How does the script relate the concept of state variables to the internal energy of a system?
-The script mentions that state variables like pressure and volume remain the same when the system returns to its initial state after a cycle, implying no change in internal energy, which is a state function that depends only on the current state of the system, not the path taken.
What is the role of calculus in understanding the work done in thermodynamic processes as described in the script?
-Calculus, specifically the concept of integration, is used to calculate the exact area under the curve on a PV-diagram, which represents the work done by or to the system. This is an advanced concept that provides a precise measure of work in thermodynamic processes.
Outlines
🔧 Mechanics of Expansion Work in a System
This paragraph explains the concept of work done by a system when it expands. It uses the analogy of a movable ceiling with a piston and pebbles to illustrate how pressure, force, and area relate to the work done during expansion. The key formula derived is work as the product of pressure and change in volume. The explanation also touches on the conditions for a quasi-static process where the pressure is assumed to be constant over small increments of volume change. The paragraph concludes by connecting this concept to the PV-diagram, emphasizing the usefulness of such diagrams in thermodynamics.
📈 Relating Work Done to the PV-Diagram
The second paragraph delves deeper into the relationship between the work done by a system and its representation on a PV-diagram. It describes how the work done at each stage of a quasi-static process can be visualized as the area of rectangles under the pressure-volume curve. The paragraph explains that as the system transitions from one state to another by removing pebbles, the work done is represented by the area under the curve. It also introduces the idea that the work done can be calculated more accurately by using smaller increments of volume change, eventually leading to the concept of integration in calculus for finding the exact area under the curve.
🔄 Directionality and Compression in Work Calculation
This paragraph discusses the importance of directionality in calculating work done by or to a system. It differentiates between the work done by the system when it expands (increasing volume) and when it is compressed (decreasing volume). The paragraph uses the PV-diagram to illustrate that the work done to the system is represented by the area under the curve when the system is being compressed. It introduces the concept of net work done by considering a cycle in the PV-diagram, where the internal energy change is zero if the system returns to its initial state, regardless of the path taken.
🔄 The Significance of Closed Loops in PV-Diagrams
The final paragraph emphasizes the significance of closed loops in PV-diagrams, which represent the net work done by a system when it returns to its initial state. It explains that the area inside a closed loop is indicative of the work done by the system, taking into account both expansion and compression phases. The paragraph also reiterates the concept that state variables, such as internal energy, are independent of the path taken and only depend on the initial and final states. This understanding is crucial for grasping the foundational principles of thermodynamics.
Mindmap
Keywords
💡Work
💡System
💡Quasi-static process
💡PV-diagram
💡Pressure
💡Volume
💡Internal energy
💡State
💡Expansion
💡Compression
💡State function
Highlights
A system can do work by expanding, as demonstrated with a movable ceiling and a piston.
The force applied by the system is calculated by multiplying pressure by the area of the piston.
Work done by the system can be expressed as pressure times the change in volume.
In a quasi-static process, the change in volume is assumed to be very small, and pressure is roughly constant.
For large changes in volume or sudden changes, pressure will change as the system expands, complicating the calculation of work.
The PV-diagram is used to explain quasi-static processes and define macrostates.
The internal energy formula is derived from the work done by the system, with a minus sign indicating energy given away.
The path of a system transitioning from one state to another is described using a quasi-static process.
The benefit of quasi-static processes is that they provide a clear path from one state to another, with well-defined macrostates.
The work done at any point by the system is the pressure times the change in volume, which can be visualized on a PV-diagram.
The area under the curve on a PV-diagram represents the work done by the system as it undergoes a process.
The work done by the system can be calculated by summing the areas of rectangles formed by pressure and volume changes.
In calculus, the work done is the integral of pressure as a function of volume from the initial to the final volume.
When work is done to the system, the direction of the process on the PV-diagram is reversed, affecting the calculation of work.
The net work done by a system can be found by comparing the areas under different paths on the PV-diagram.
The area inside a closed loop on a PV-diagram represents the net work done by the system, independent of the path taken.
For ideal gases, the internal energy remains the same if the system returns to its initial state, regardless of the path taken.
Transcripts
Browse More Related Video

Work from expansion | Thermodynamics | Physics | Khan Academy
Enthalpy | Thermodynamics | Chemistry | Khan Academy
Quasistatic and reversible processes | Thermodynamics | Physics | Khan Academy
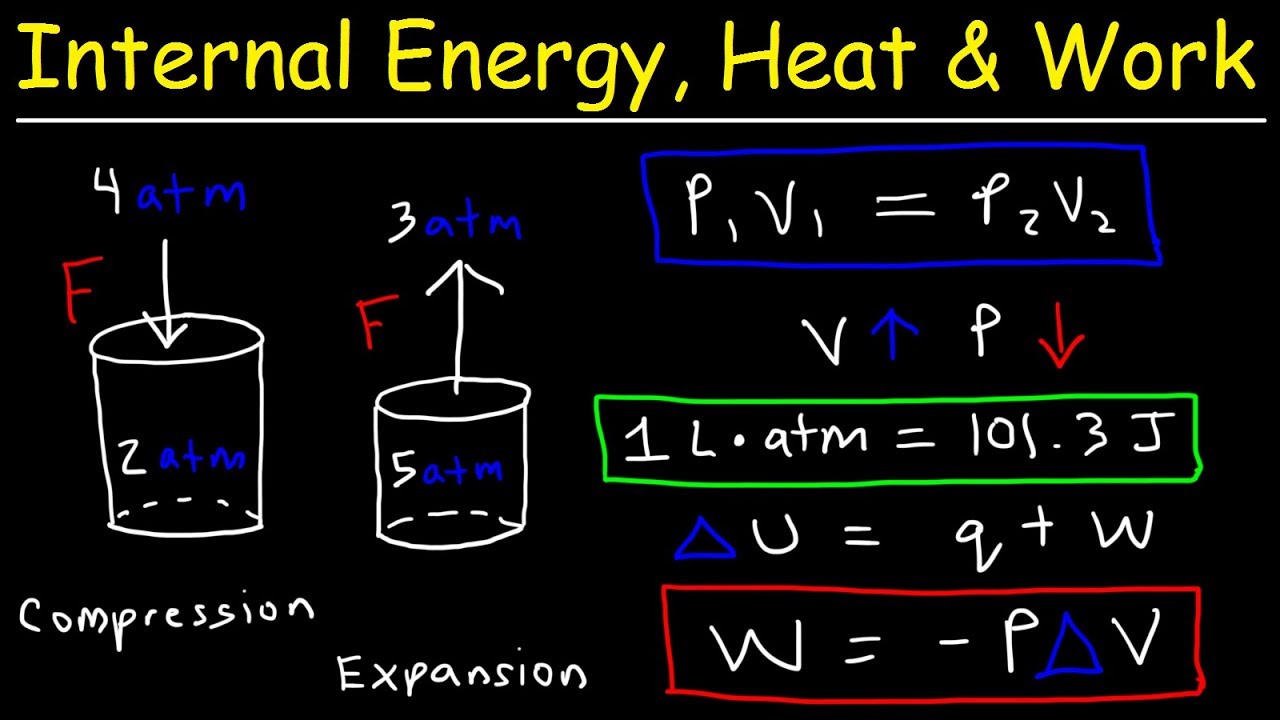
Internal Energy, Heat, and Work Thermodynamics, Pressure & Volume, Chemistry Problems
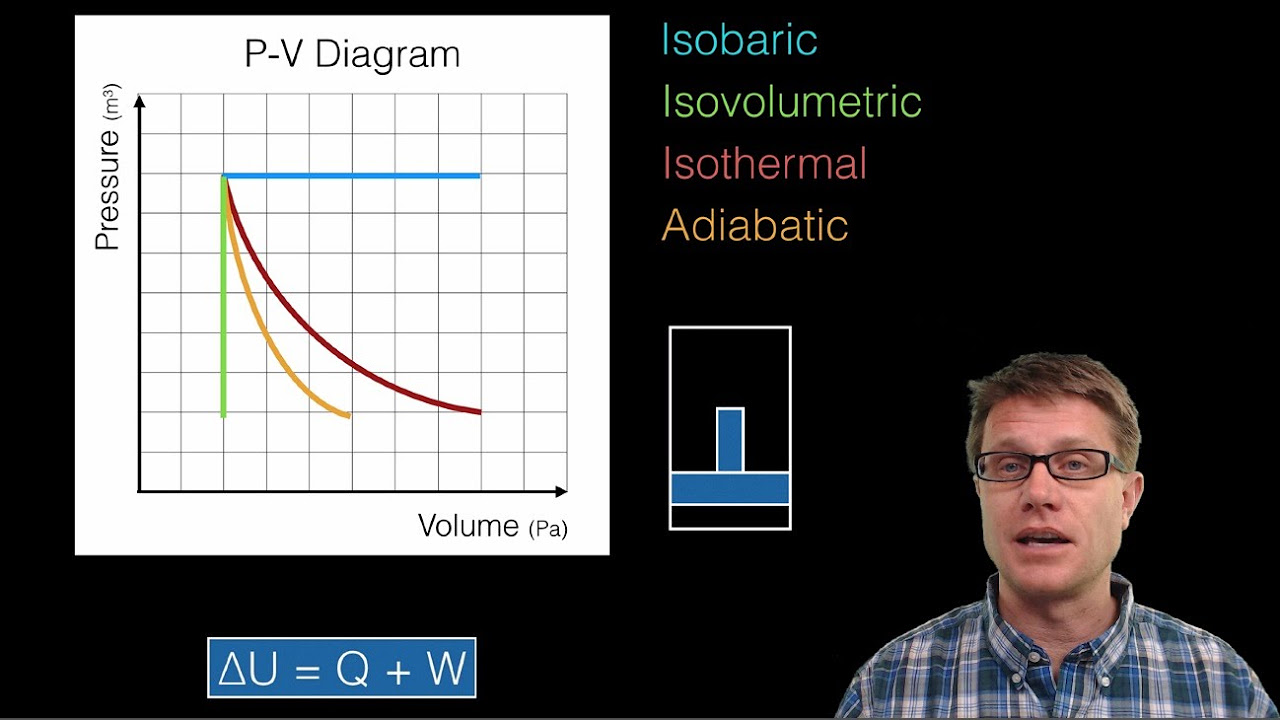
Thermodynamics and P-V Diagrams
Thermodynamic Processes (Animation)
5.0 / 5 (0 votes)
Thanks for rating: