Thermodynamics and P-V Diagrams
TLDRThis AP Physics video by Mr. Andersen explores thermodynamics through p-v diagrams, illustrating how energy is transferred in an ideal gas within a piston. It explains the first law of thermodynamics and the equation ΔU = Q + W, where ΔU is change in internal energy, Q is heat, and W is work. The video uses a fire piston example, a PHET simulation, and diagrams to demonstrate various processes like isothermal, isovolumetric, isobaric, and adiabatic. It clarifies the concept of work done by the system or surroundings and how to interpret P-V diagrams to understand energy changes.
Takeaways
- 🔥 The video introduces a fire piston, a device used to generate heat and start fires by compressing air, demonstrating a practical application of thermodynamics.
- 📚 The first law of thermodynamics is discussed, stating that energy cannot be created or destroyed, and is applied to an idealized gas in a piston.
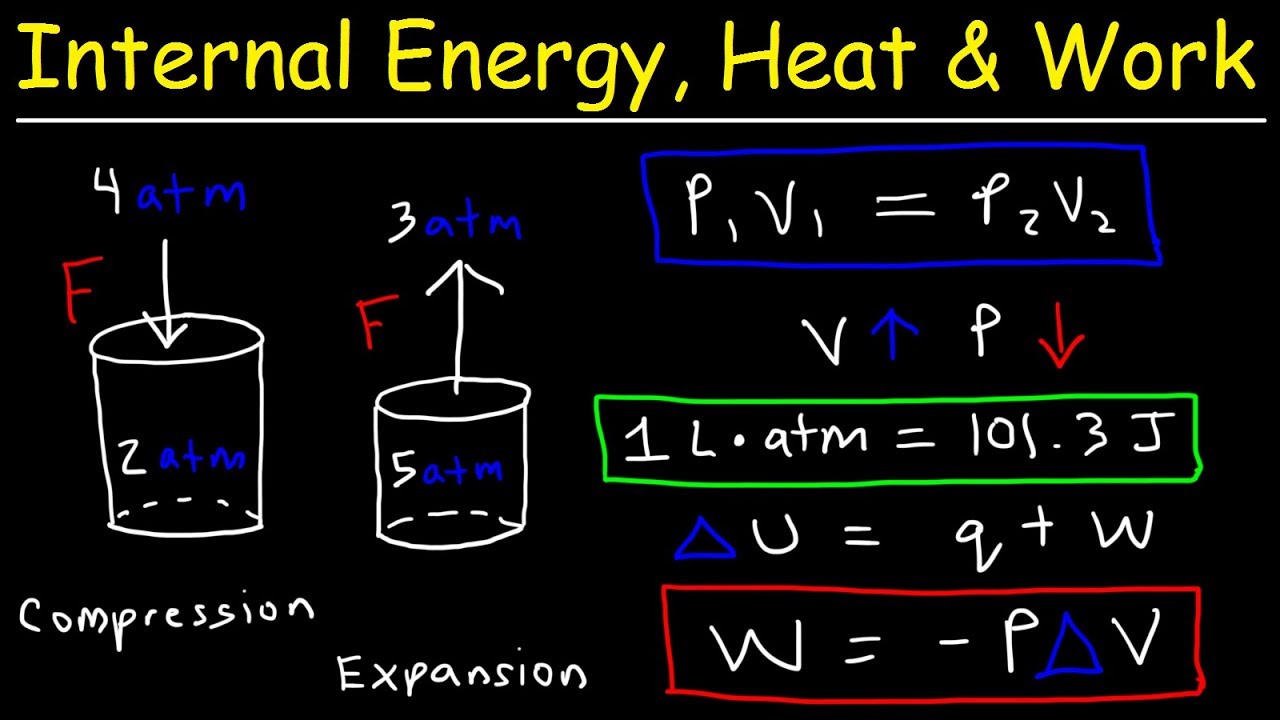
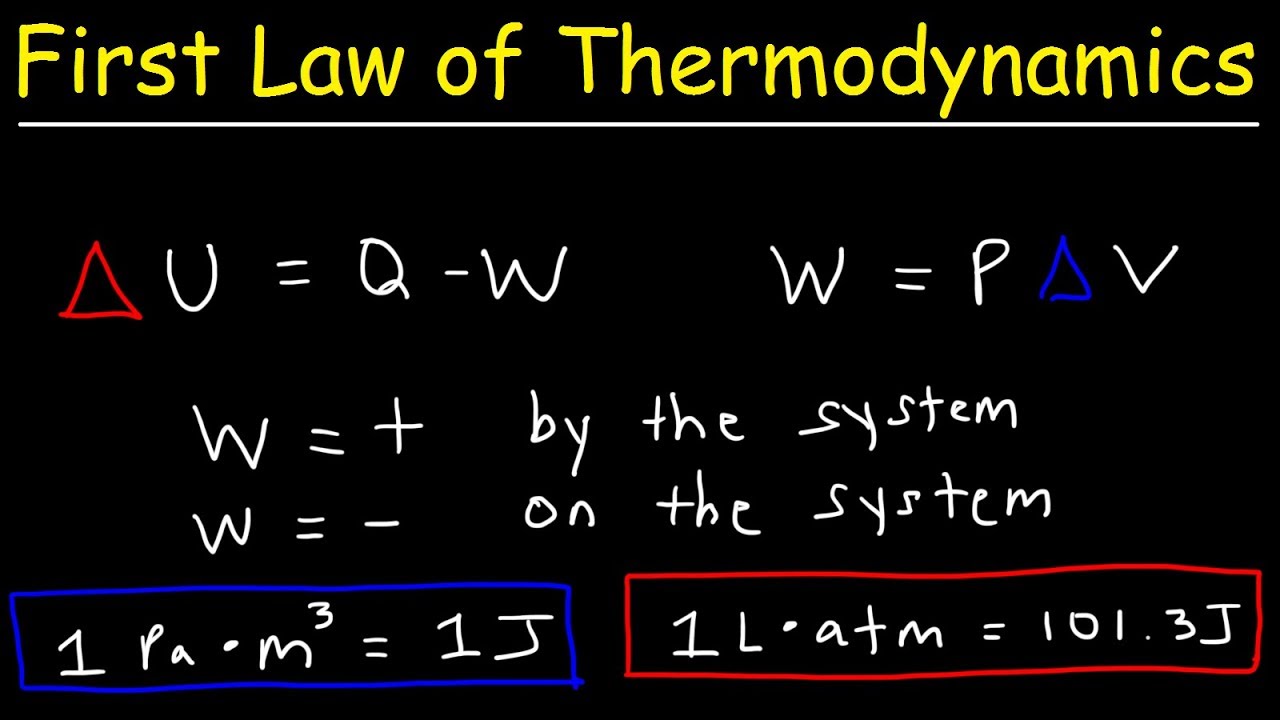
- ⚖️ The equation ΔU = Q + W is presented, where ΔU is the change in internal energy, Q is heat, and W is work, illustrating how energy is transferred in a system.
- 📈 The use of a pressure-volume (P-V) diagram is explained as a method to measure changes in a system's internal energy over time.
- 🔨 The concept of work in a piston is clarified, with the area under the curve in a P-V diagram representing the work done by the gas.
- 🌡️ An isothermal process is described, where the temperature remains constant while work is done on the system, resulting in a change in pressure and volume.
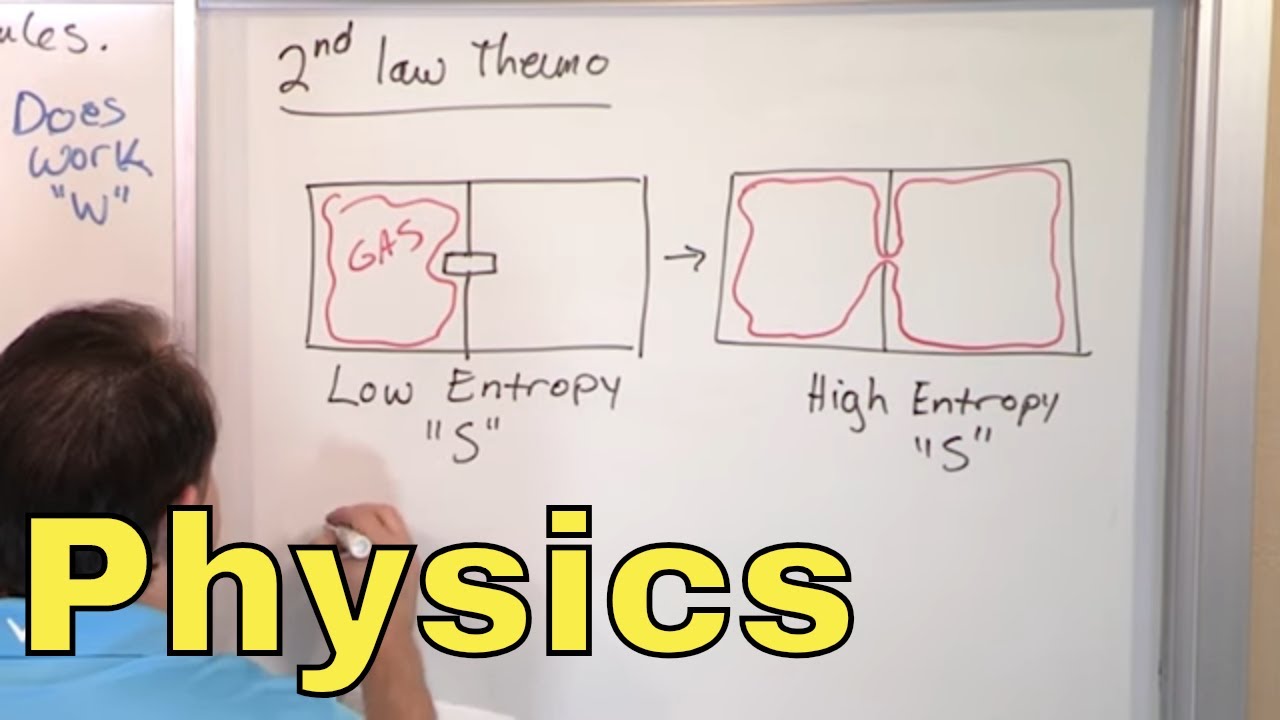
- 🔄 Different types of thermodynamic processes are introduced: isovolumetric (constant volume), isobaric (constant pressure), and adiabatic (no heat exchange).
- 🔧 The video uses a PHET simulation to visually demonstrate how adding heat or doing work can change the internal energy of a gas within a piston.
- 📊 The importance of understanding the direction of work (whether it's done by the system or on the system) is emphasized through the P-V diagram.
- 📉 The video explains how to identify different thermodynamic processes on a P-V diagram by their characteristic curves: horizontal for isobaric, vertical for isovolumetric, and curved for isothermal and adiabatic.
- 🔍 The final takeaway is the ability to calculate the amount of work done by the gas, which is represented by the area under the curve on a P-V diagram.
Q & A
What is a fire piston and how does it work?
-A fire piston is a device used to create fire by generating heat through rapid compression. It works by placing tinder, like cotton, at the bottom and slamming the piston with a hand, which heats it up due to the rapid compression without allowing heat to escape, thus igniting the tinder.
What is the first law of thermodynamics and how does it relate to the fire piston?
-The first law of thermodynamics, also known as the law of conservation of energy, states that energy cannot be created or destroyed, only transferred or changed from one form to another. In the context of the fire piston, this law is demonstrated as the mechanical work done by slamming the piston is converted into heat energy, which is then used to ignite the tinder.
What does the equation ΔU = Q + W represent in the context of thermodynamics?
-In thermodynamics, ΔU represents the change in internal energy of a system, Q is the heat added to the system, and W is the work done on or by the system. The equation ΔU = Q + W shows how the internal energy of a system can change due to heat transfer and work done.
How is work defined in the context of a piston system?
-In a piston system, work (W) is defined as the force applied over a distance, which can be visualized as the area under the curve on a pressure-volume (P-V) diagram. Positive work is done by the system when it expands, and negative work is done on the system when it is compressed.
What is an isothermal process in a piston system?
-An isothermal process is one in which the temperature of the system remains constant while work is done on or by the system. This can be visualized on a P-V diagram as a curve, where the system undergoes changes in volume and pressure while maintaining a constant temperature.
What is the difference between positive and negative work in a piston system?
-Positive work is done by the system when it expands, meaning energy is transferred from the system to the surroundings. Negative work is done on the system when it is compressed, meaning energy is transferred from the surroundings to the system.
What are the different types of processes that can be represented on a P-V diagram?
-The different types of processes that can be represented on a P-V diagram include isothermal (constant temperature), isobaric (constant pressure), isovolumetric (constant volume), and adiabatic (no heat exchange with the surroundings).
How can the area under the curve on a P-V diagram be used to determine the work done?
-The area under the curve on a P-V diagram represents the work done by or on the system. If the area is to the right of the initial state, it indicates positive work done by the system (expansion). If the area is to the left, it indicates negative work done on the system (compression).
What is an isovolumetric process and how does it appear on a P-V diagram?
-An isovolumetric process is one where the volume of the system remains constant. On a P-V diagram, this appears as a vertical line, indicating that the pressure changes while the volume stays the same, typically due to heat being added or removed.
How does the PHET simulation demonstrate the principles of thermodynamics?
-The PHET simulation allows users to manipulate variables such as temperature and pressure in a closed system with a movable piston. It visually demonstrates how changes in these variables affect the internal energy, pressure, and volume of the system, helping to illustrate the principles of thermodynamics.
What is an adiabatic process and how does it differ from other processes on a P-V diagram?
-An adiabatic process is one where no heat is exchanged with the surroundings, occurring very quickly so that there is no time for heat to enter or leave the system. On a P-V diagram, an adiabatic process appears as a curved line that is not horizontal or vertical, indicating changes in both pressure and volume without heat transfer.
Outlines
🔥 Introduction to Thermodynamics and Fire Piston
This paragraph introduces the topic of thermodynamics and its relation to the conservation of energy, particularly the first law of thermodynamics which states that energy cannot be created nor destroyed. Mr. Andersen uses the example of a fire piston, an ancient method of starting a fire by generating heat through rapid compression, to demonstrate the principle. The discussion transitions into how energy is transferred into and out of a system, such as a gas within a piston, through heat (Q) and work (W). The concept of p-v diagrams, or pressure-volume diagrams, is introduced as a means to visualize these energy transfers over time, with the area under the curve on such a diagram representing the work done by the system.
📈 Understanding Different Processes with P-V Diagrams
This paragraph delves into various thermodynamic processes using p-v diagrams, including isothermal, isovolumetric, isobaric, and adiabatic processes. The PHET simulation is used to illustrate these processes, showing how the internal energy of a system changes with temperature and work done on or by the system. The paragraph explains that in an isothermal process, the temperature remains constant while the volume changes, resulting in a curved path on the p-v diagram. Isovolumetric processes keep the volume constant, leading to changes in pressure and a vertical line on the diagram. Isobaric processes maintain a constant pressure, allowing the volume to change and resulting in a horizontal line. Finally, adiabatic processes occur so quickly that no heat exchange happens with the surroundings, causing a non-linear curve. The paragraph concludes with a focus on how to identify these processes on a p-v diagram and calculate the work done by finding the area under the curve.
Mindmap
Keywords
💡Thermodynamics
💡p-v diagrams
💡First Law of Thermodynamics
💡Internal Energy (delta U)
💡Heat (Q)
💡Work (W)
💡Isothermal Process
💡Isobaric Process
💡Isovolumetric Process
💡Adiabatic Process
💡Conservation of Energy
Highlights
Introduction to thermodynamics and p-v diagrams (pressure-volume diagrams).
Explanation of a fire piston as an example of energy transfer through heat without escape.
The first law of thermodynamics emphasizing energy conservation.
Equation for change in internal energy (delta U) in terms of heat (Q) and work (W).
Describing the process of compressing a piston and the resulting increase in pressure.
Clarification on who does the work in a piston system and the concept of negative work.
Isothermal process explanation and its representation on a p-v diagram.
Different types of thermodynamic processes: isovolumetric, isobaric, and adiabatic.
Introduction to a PHET simulation to demonstrate energy transfer in a gas.
How adding or removing heat affects the energy and pressure within a system.
The importance of tracking volume and pressure to understand thermodynamic processes.
Explanation of an isobaric process and its graphical representation on a P-V diagram.
Description of an isovolumetric process and its effect on pressure and temperature.
The concept of isothermal processes and maintaining constant temperature.
Adiabatic processes and their quick changes in temperature without heat exchange.
Using the PHET simulation to model different thermodynamic processes.
Understanding the relationship between work, heat, and internal energy changes.
Identifying the type of process from a P-V diagram and calculating work done.
Transcripts
Browse More Related Video
Internal Energy, Heat, and Work Thermodynamics, Pressure & Volume, Chemistry Problems

The First Law of Thermodynamics: Internal Energy, Heat, and Work
Enthalpy | Thermodynamics
First Law of Thermodynamics, Basic Introduction, Physics Problems
02 - Introduction to Physics, Part 2 (Thermodynamics & Waves) - Online Physics Course

Thermodynamics: Crash Course Physics #23
5.0 / 5 (0 votes)
Thanks for rating: