Statistics 101: Introduction to the Chi-square Test
TLDRThis video series introduces basic statistics with a focus on the Chi-Square test, a common hypothesis testing method often misunderstood. The script simplifies the concept for beginners, discussing its application to categorical data and explaining the process step-by-step through an example involving dice. It clarifies the importance of distinguishing between observed and expected frequencies and the role of the Chi-Square distribution in hypothesis testing, aiming to determine if observed variations are due to chance or indicate a significant pattern.
Takeaways
- 📚 The video series focuses on basic statistics, particularly for individuals who are new to the subject or need a review of fundamental concepts.
- 🔍 The video introduces the Chi-Square test, a statistical method often misunderstood in hypothesis testing, and aims to clarify its application step by step.
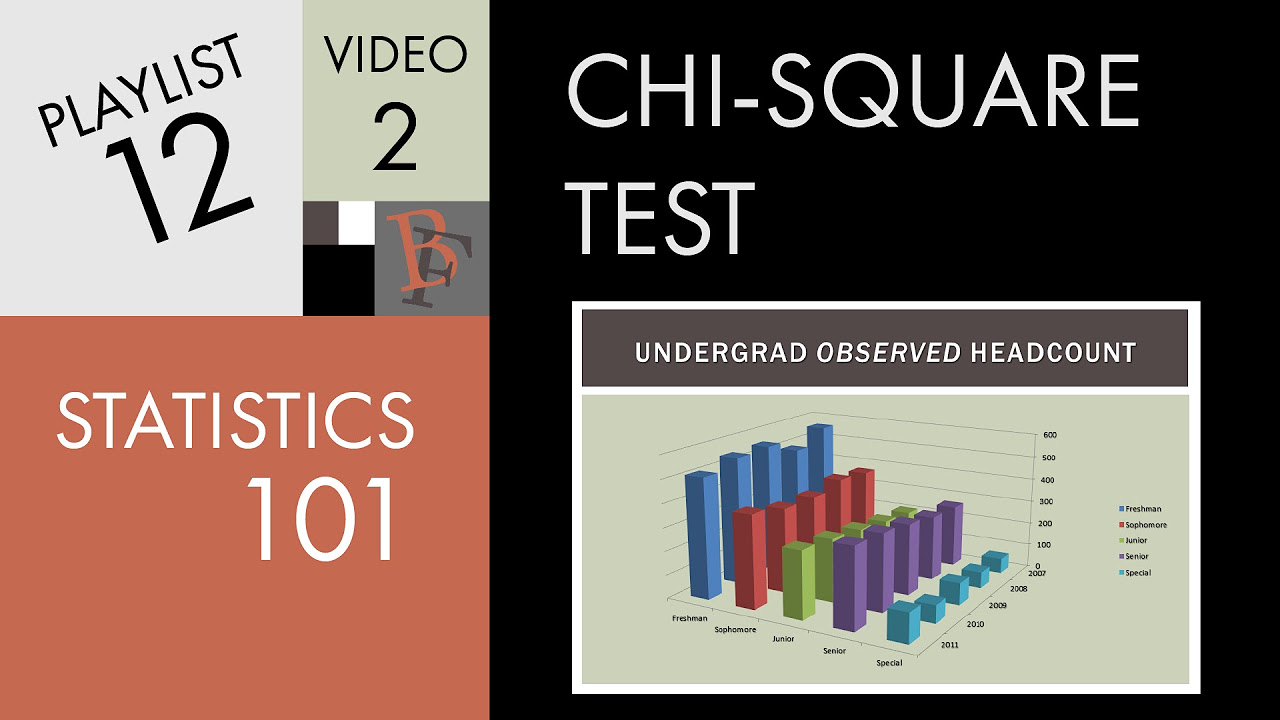
- 📈 The Chi-Square test is used to examine the relationship between two categorical variables, such as class levels (freshman, sophomore, etc.) and years in an educational context.
- 🎲 A dice experiment is used to illustrate the Chi-Square test, comparing observed frequencies of dice rolls to expected frequencies to determine if a die is fair or loaded.
- 📉 The video discusses various types of graphs, including line graphs, bar charts, and spider diagrams, to visualize and interpret data effectively.
- 📊 Graphs help in understanding data patterns, such as enrollment trends over time, and can reveal whether variations are within expected random fluctuations or indicate a different trend.
- 🎯 The Chi-Square test determines if observed data varies significantly from expected values, which can help rule out random chance as the sole cause of the variation.
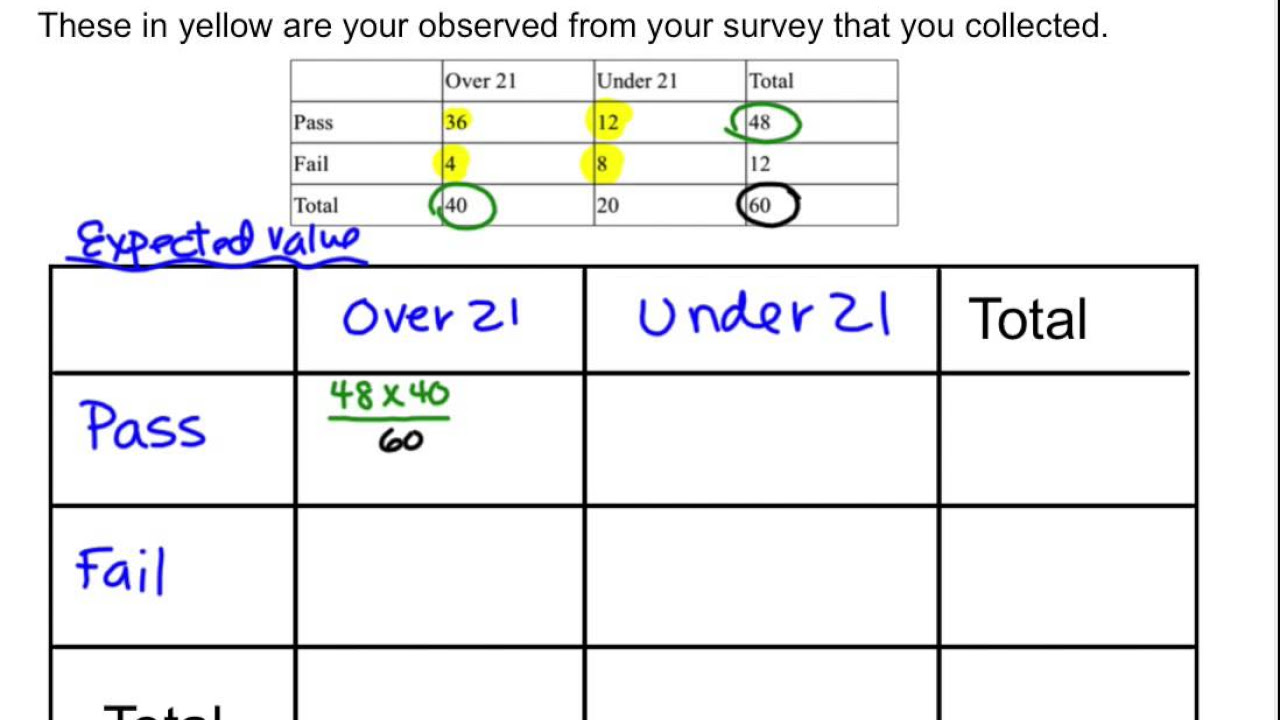
- 🔢 The Chi-Square calculation involves subtracting expected frequencies from observed ones, squaring the result, and dividing by the expected frequency, then summing these values.
- 📉 The Chi-Square distribution and critical values are used to decide whether to accept or reject the null hypothesis, which in the dice example states that the die is fair.
- 🤔 The choice of P-value affects the strictness of the test; a lower P-value requires more significant variation to reject the null hypothesis, thus affecting the confidence in the conclusions.
- 🔑 The video emphasizes the importance of correct pronunciation and understanding of the Chi-Square test, as well as the impact of hypothesis testing in analyzing categorical data.
Q & A
What is the primary focus of the video series on basic statistics?
-The video series focuses on introducing and explaining basic concepts in statistics, particularly aimed at individuals who are new to the subject or need a review of fundamental ideas.
What is the purpose of the video on the Chi-Square test?
-The purpose of the video is to introduce the Chi-Square test, explain its common misunderstandings, set up a complex problem for the next video, and demonstrate a simple Chi-Square test step by step.
What is the significance of the Chi-Square test in hypothesis testing?
-The Chi-Square test is significant in hypothesis testing as it helps to determine whether there is a significant difference between the expected frequencies and the observed frequencies in categorical data.
What type of data does the Chi-Square test analyze?
-The Chi-Square test analyzes categorical data, comparing observed frequencies with expected frequencies to determine if the variation is due to random chance or some other factor.
What is the correct pronunciation of 'Chi-Square' as mentioned in the video?
-The correct pronunciation of 'Chi-Square' is 'Kai Square', rhyming with 'kite', not 'cheetah' or 'chai'.
What is the null hypothesis in the context of the dice experiment presented in the video?
-The null hypothesis in the dice experiment is that the die is fair, meaning that each roll has an equal probability of resulting in any of the six numbers.
What is the alternative hypothesis in the dice experiment?
-The alternative hypothesis is that the die is not fair, suggesting that the variation in the observed frequencies of the numbers rolled is not due to random chance alone.
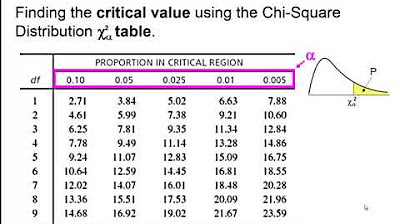
How does the video use the concept of 'degrees of freedom' in the context of the Chi-Square test?
-In the video, degrees of freedom are used to calculate the Chi-Square critical value. For the dice experiment, the degrees of freedom are calculated as the number of categories (6) minus one, resulting in 5.
What is the role of the P-value in the Chi-Square test?
-The P-value determines the level of significance or the strictness with which we accept random variation in the data. A smaller P-value indicates a stricter threshold for rejecting the null hypothesis.
How does the video illustrate the impact of changing the P-value on the Chi-Square test outcome?
-The video demonstrates that changing the P-value affects the Chi-Square critical value. A more stringent P-value (e.g., 0.01 instead of 0.05) increases the critical value, requiring greater observed variation to reject the null hypothesis.
What visual aids does the video recommend for better understanding and presenting statistical data?
-The video recommends using various types of graphs such as simple line graphs, stacked bar charts, stacked percentage bar charts, stacked area charts, stacked percentage area charts, and spider or radar diagrams to visualize and better understand the data.
Outlines
📚 Introduction to Basic Statistics and Chi-Square Test
The script introduces a video series on basic statistics with a focus on the Chi-Square test, a common hypothesis testing method often misunderstood. The speaker clarifies terminology, noting 'stats' as a preferred term for ease of speech. The videos aim to simplify concepts for beginners or those needing a review. The script sets up a complex problem involving student headcounts at a university over five years, with variations observed across different undergraduate levels. The goal is to determine if the variation is beyond what would be expected by chance. The speaker promises a step-by-step guide to performing and interpreting a Chi-Square test in subsequent videos.
📊 Visualizing Data with Various Graphs
This paragraph delves into the importance of using graphs to visualize data for better understanding and communication. The speaker discusses several graphing options, including line graphs, stacked bar charts, stacked percentage bar charts, stacked area charts, stacked percentage area charts, and spider or radar diagrams. Each graph type offers a unique perspective on the data, from showing changes over time to relative proportions and percentages. The example data of student enrollments across different class levels and years is used to illustrate how these graphs can reveal patterns and variations that are not as apparent in raw numbers.
🎲 The Chi-Square Test and Dice Experiment
The speaker introduces the Chi-Square test, emphasizing its correct pronunciation as 'Chi-Square' like 'kite.' The test is used to examine the relationship between two categorical variables and to determine if observed frequencies differ significantly from expected frequencies, indicating more than just random chance. A dice-rolling experiment is proposed to demonstrate the test's application. The experiment involves rolling two dice, one fair and one loaded, and recording the outcomes over 600 rolls. The expected result for a fair die is evenly distributed outcomes, which will be compared against the observed results to determine the die's fairness with a 95% confidence level.
🔢 Hypothesis Formulation and Chi-Square Calculation
The script explains the process of formulating hypotheses for the Chi-Square test, with the null hypothesis (H0) assuming the die is fair and the alternative hypothesis (H1) suggesting it is not. The concept of P-value is introduced as a measure of tolerance for variation, with a P value of 0.05 chosen for the test. Degrees of freedom are mentioned as a statistical concept relevant to the Chi-Square test, with the example having five degrees of freedom. The Chi-Square critical value is calculated using Excel, resulting in a value of 11.07, which serves as the threshold for determining the die's fairness.
📉 Interpreting Chi-Square Results and the Impact of P-Value
The results of the Chi-Square test are interpreted, with a Chi-Square value of 12.26 calculated from the dice experiment, exceeding the critical value of 11.07, leading to the rejection of the null hypothesis and the conclusion that the die is not fair. The significance of the P-value in determining the strictness of the test is highlighted. By changing the P-value to 0.01, the critical Chi-Square value increases to 15.09, showing that a more stringent P-value requires greater observed variation to reject the null hypothesis. The same observed data leads to different conclusions based on the chosen P-value.
📈 Review of Chi-Square Test and Upcoming Application
The script provides a review of the Chi-Square test, summarizing its purpose for analyzing the relationship between categorical variables and comparing observed frequencies with expected ones to determine if the variation is due to random chance. The use of the Chi-Square distribution and critical values to accept or reject hypotheses is reiterated. The speaker reminds viewers that the next video will apply the Chi-Square test to the previously introduced university enrollment data, aiming to assess whether the observed variations in student headcounts can be attributed to random chance.
Mindmap
Keywords
💡Statistics
💡Chi-Square Test
💡Hypothesis Testing
💡Null Hypothesis (H0)
💡Alternative Hypothesis (H1)
💡Degrees of Freedom
💡Critical Value
💡P-Value
💡Observed Frequency
💡Expected Frequency
💡Graphs and Data Visualization
Highlights
Introduction to the Chi-Square test, a commonly misunderstood test in hypothesis testing.
Explanation of the pronunciation of 'Chi-Square' as 'Kai Square', not 'Chi' or 'Chai'.
The Chi-Square test is used to understand the relationship between two categorical variables.
The test involves comparing observed frequencies with expected frequencies.
The importance of using graphs to visualize data for better understanding and interpretation.
Different types of graphs for data visualization: line graph, stacked bar chart, stacked percentage bar chart, stacked area chart, stacked percentage area chart, and spider or radar diagram.
The use of a dice experiment to demonstrate the Chi-Square test process.
Setting up a hypothesis for the Chi-Square test with a null hypothesis (H0) and an alternative hypothesis (H1).
The concept of P-value and its significance in determining the tolerance for variation in data.
Calculation of the Chi-Square statistic through a step-by-step process involving subtraction, squaring, and division.
Interpretation of the Chi-Square result using the critical value to decide whether to reject the null hypothesis.
The impact of changing the P-value on the Chi-Square critical value and the strictness of accepting random variation.
The importance of being 95% confident in the conclusion drawn from the Chi-Square test.
An example of how changing the P-value from 0.05 to 0.01 affects the conclusion of the Chi-Square test.
Review of the Chi-Square test process and its purpose in hypothesis testing.
Upcoming application of the Chi-Square test to more complex data involving student enrollment data.
Transcripts
Browse More Related Video
Elementary Statistics - Chapter 11 Chi Square Goodness of Fit Test

Elementary Statistics Lesson #23A
Statistics 101: Chi-square in Excel using College Enrollment Data
Calculating Expected values and Chi Squared Values

What is Hypothesis Testing ? Math, Statistics for data science, machine learning
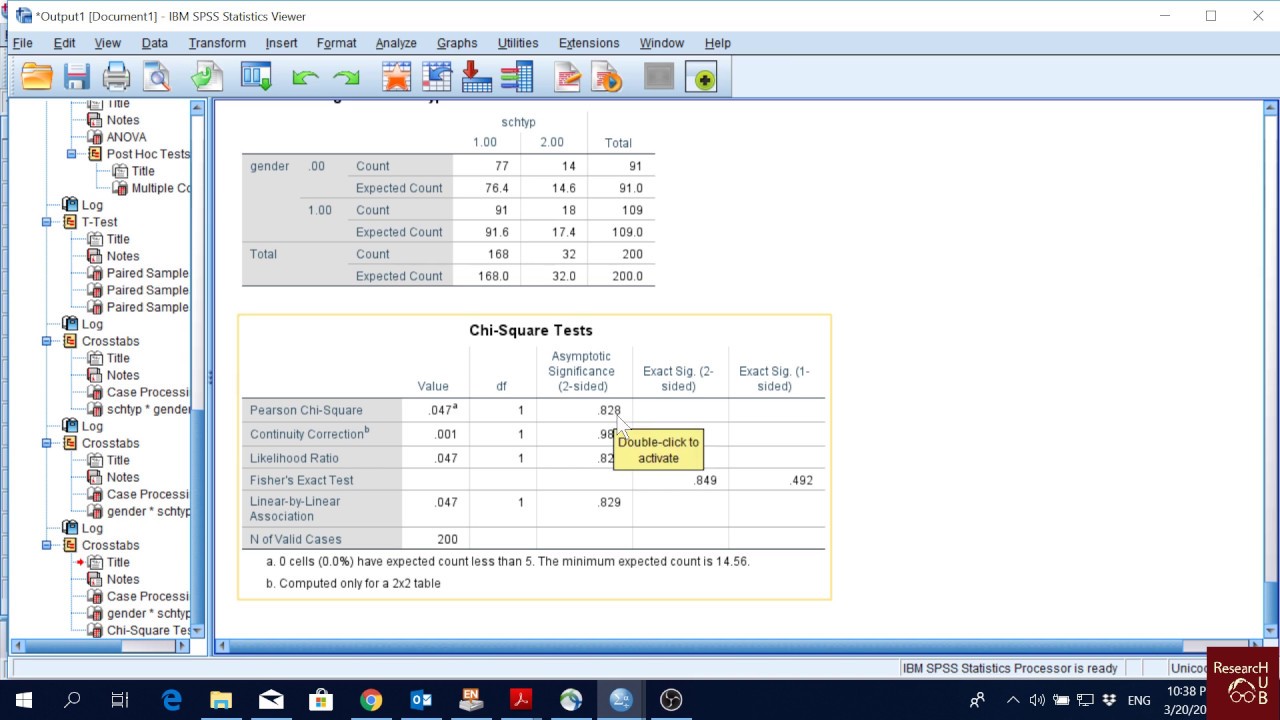
SPSS (10): Chi-Square Test
5.0 / 5 (0 votes)
Thanks for rating: