Mean, Median, Mode, and Outliers: Measures of Central Tendency
TLDRThis video from 'Psych Explain' explores the concepts of mean, median, and mode—key measures of central tendency used to identify the center of a data set. It explains how to calculate each measure using sleep hours as an example and discusses when to use each, emphasizing their utility in understanding data clustering. The video also highlights the importance of median over mean in the presence of outliers and the unique ability of mode to represent nominal data, providing practical examples from sports and housing prices.
Takeaways
- 📊 The video discusses three measures of central tendency: mean, median, and mode, which are used to describe where data clusters around the center.
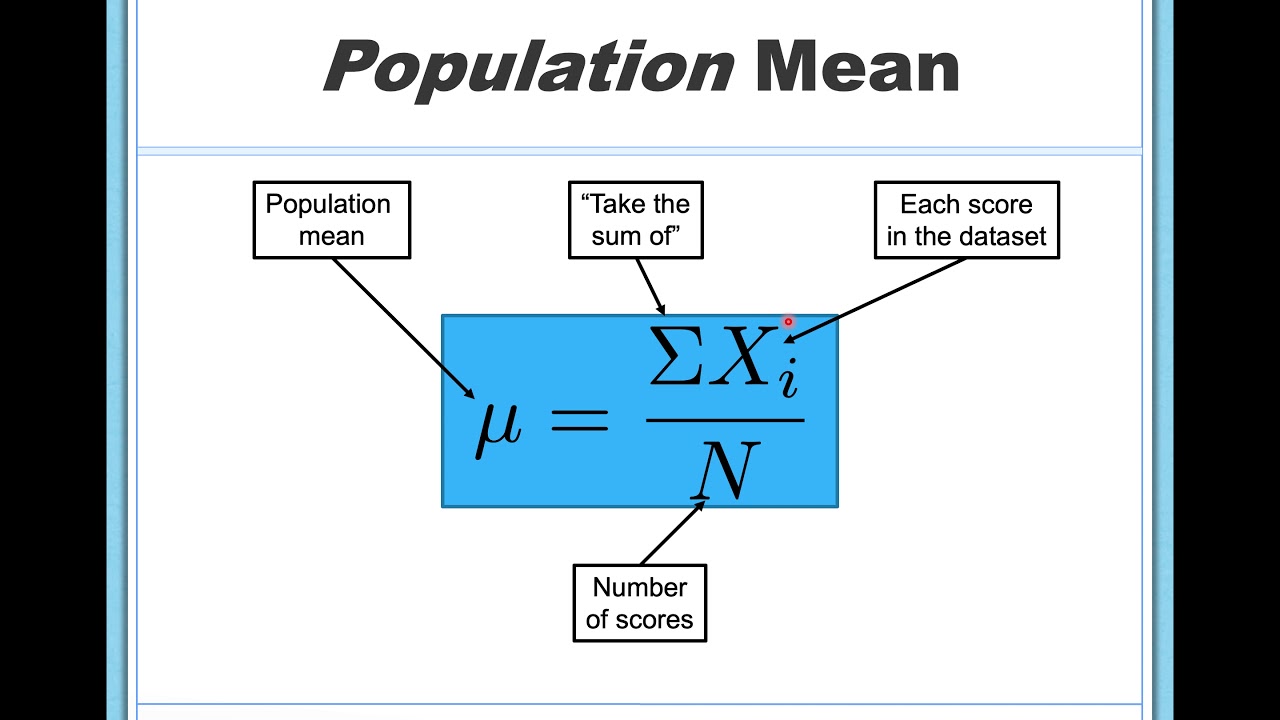
- 🔢 The mean is the arithmetic average of all data points and is calculated by summing all values and dividing by the number of data points.
- 📈 The median is the middle value in a data set when arranged in numerical order and is used when data has outliers.
- 🏁 The mode is the most frequently occurring value in a data set and can represent both numerical and categorical data.
- 🤔 The choice between mean, median, and mode depends on the data set's characteristics, such as the presence of outliers.
- 🏠 An example given in the video is using the median for house prices, as it is less affected by extremely high or low values.
- 📈 Outliers can skew the mean, making it less representative of the data set's central tendency compared to the median.
- 📊 The video provides a practical example using sleep hours data to illustrate how to calculate the mean, median, and mode.
- 🔑 The mode can be used to identify the most common category in nominal or categorical data, such as the most popular sports team among fans.
- 📚 The video emphasizes the importance of understanding when to use each measure for accurately representing data.
- 📝 The script concludes with a practice problem for viewers to apply the concepts of mean, median, and mode to a new data set.
Q & A
What are the three measures of central tendency discussed in the video?
-The three measures of central tendency discussed in the video are the mean, the median, and the mode.
Why are the mean, median, and mode often discussed together?
-The mean, median, and mode are often discussed together because they all help explain where the data is clustering around or where the center of the data is.
What is the mean and how is it calculated?
-The mean is considered the average or arithmetic average of a data set. It is calculated by adding up all the individual data points and then dividing the sum by the total number of data points.
Under what circumstances would the mean be the best measure of central tendency to use?
-The mean is the best measure of central tendency to use when all the data points are relatively the same, and there are no outliers.
What is the median and how is it found?
-The median is the middle value in a data set when the numbers are arranged in numerical order. If there is an odd number of data points, the median is the middle number. If there is an even number of data points, the median is the average of the two middle numbers.
Why would the median be preferred over the mean in certain situations?
-The median is preferred over the mean when there are outliers in the data set, as it is less affected by extreme values and provides a better representation of the central tendency.
What is the mode and how is it determined?
-The mode is the most frequent number in a data set. It is determined by identifying the data point that occurs most often.
Can there be no mode or multiple modes in a data set?
-Yes, there can be no mode if no number repeats, or there can be multiple modes if two or more numbers repeat with the same frequency.
Why is the mode unique among the measures of central tendency?
-The mode is unique because it can represent not just numbers, but also categories or nominal data, making it versatile for different types of data analysis.
What is an example of using the mode in a non-numerical context?
-An example of using the mode in a non-numerical context is determining the most popular sports team among a group of fans, where the team with the most supporters is the mode.
What is the purpose of the practice problem provided at the end of the video?
-The purpose of the practice problem is to allow viewers to apply the concepts of mean, median, and mode to a data set and test their understanding of these measures of central tendency.
Outlines
📊 Introduction to Measures of Central Tendency
The video script introduces the concepts of mean, median, and mode, which are measures of central tendency used to describe the center or middle of a data set. It explains that these measures help to understand where data clusters around, as opposed to measures like standard deviation that explain variability. The script outlines the purpose of the video, which is to discuss what the mean, median, and mode are, how to find them, and when to use each measure. An example data set of hours of sleep is presented to illustrate the concepts.
🔢 Understanding the Mean and Its Calculation
This paragraph delves into the concept of the mean, also known as the average or arithmetic average. It is described as the most common measure of central tendency. The script explains how to calculate the mean through a two-step process: summing all individual data points and then dividing by the total number of data points. The example of calculating the mean from a weekly sleep data set is used to illustrate the process. The paragraph also discusses when to use the mean, which is when all data points are relatively the same, and when not to use it, such as in the presence of outliers.
🏠 The Median as a Measure of Central Tendency
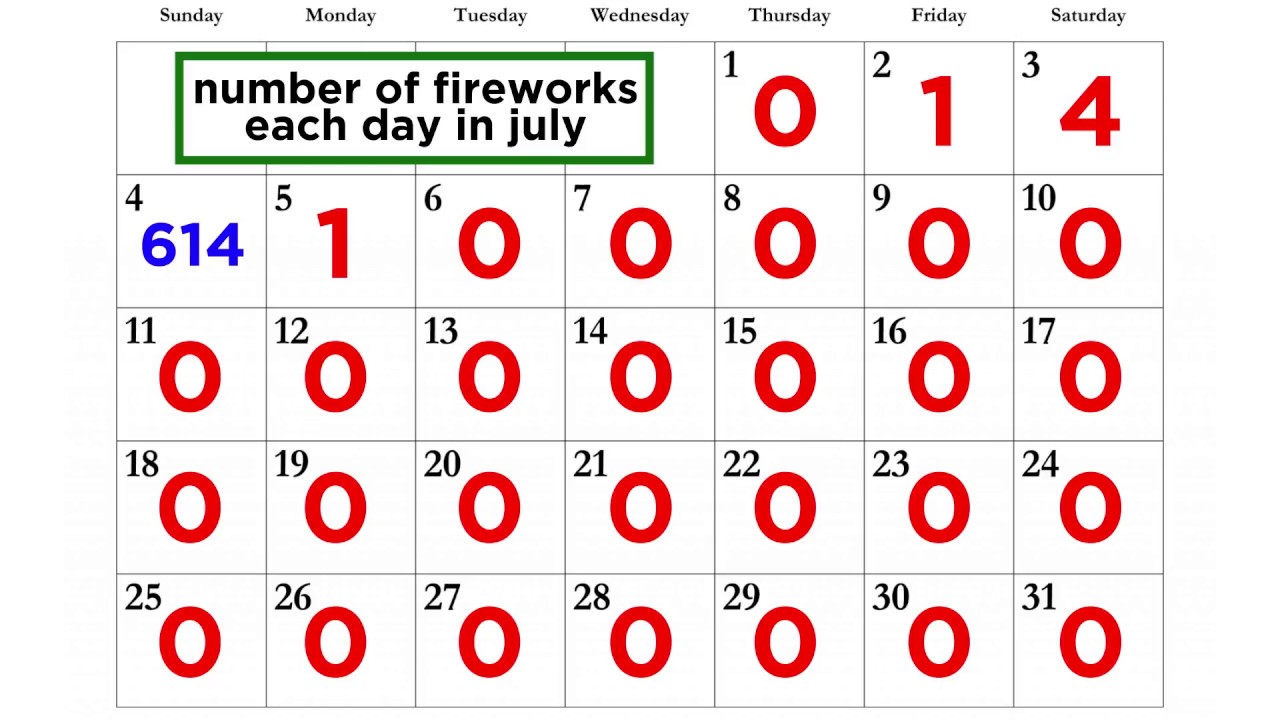
The script explains the median as the middle value in a data set when arranged in numerical order. It provides a step-by-step guide on how to find the median, whether the data set has an odd or even number of values. The paragraph uses the example of home prices to illustrate the impact of outliers on the mean and why the median is a better measure of central tendency in such cases. It emphasizes that the median is often used in real estate listings and sports statistics to provide a more accurate representation of data when outliers are present.
📈 The Mode and Its Relevance in Data Analysis
The final paragraph introduces the mode as the most frequent number in a data set. It explains that the mode can be used to analyze both numerical and categorical data, making it unique among the measures of central tendency. The script provides examples of how the mode can represent categories such as gender in a study or sports team fandom in a poll. It also discusses the possibility of having no mode, one mode, or multiple modes in a data set. The paragraph concludes with a practice problem for viewers to apply their understanding of mean, median, and mode.
Mindmap
Keywords
💡Mean
💡Median
💡Mode
💡Measures of Central Tendency
💡Outliers
💡Data Clustering
💡Arithmetic Average
💡Nominal Data
💡Categorical Data
💡Standard Deviation
💡Bell Curve
Highlights
The video discusses the mean, median, and mode as measures of central tendency in psychology.
These measures help explain where data clusters around or the center of the data.
The mean is the arithmetic average, commonly used in various real-life scenarios.
Calculating the mean involves summing all data points and dividing by the total count.
The mean is best used when all data points are relatively the same, without outliers.
The median is the middle value in a data set, representing the 50th percentile.
To find the median, data must be ordered from least to greatest.
The median is used when there are outliers in the data set.
An example of skewed data by an outlier is given with housing prices.
The mode is the most frequent number in a data set, which may not always be numerical.
The mode can represent categories, such as the most common gender in a study.
The mode provides information about nominal or categorical data.
The video provides a practical example of calculating mean, median, and mode using sleep hours.
A practice problem with a data set is presented for viewers to calculate mean, median, and mode themselves.
The video emphasizes the importance of choosing the right measure of central tendency based on data characteristics.
The mean, median, and mode are collectively referred to as measures of central tendency.
The video explains why the median is a better measure than the mean in the presence of outliers.
The mode can indicate the most popular category, such as sports team preferences.
Transcripts
Browse More Related Video
Measures of Central Tendency (Mean, Median, Mode)
Understanding Central Tendency
Mean, Median and Mode - Measures of Central Tendency
Mean, Median and Mode in Statistics | Statistics Tutorial | MarinStatsLectures
Finding mean, median, and mode | Descriptive statistics | Probability and Statistics | Khan Academy
Analyzing Sets of Data: Range, Mean, Median, and Mode
5.0 / 5 (0 votes)
Thanks for rating: