Mean, Median and Mode in Statistics | Statistics Tutorial | MarinStatsLectures
TLDRThe video script discusses measures of central tendency for numeric variables, focusing on the mean, median, trimmed mean, and mode. It explains the sample mean as a balance point sensitive to outliers, while the median is a more robust measure not affected by extreme values. The trimmed mean reduces sensitivity to outliers by excluding a certain percentage of data. The mode, the most frequent value, is less commonly used but can be useful in specific contexts. The video emphasizes understanding the concepts and the differences between parametric and nonparametric measures.
Takeaways
- 📊 The mean, or arithmetic average, is a measure of central tendency calculated by summing all values in a dataset and dividing by the number of observations.
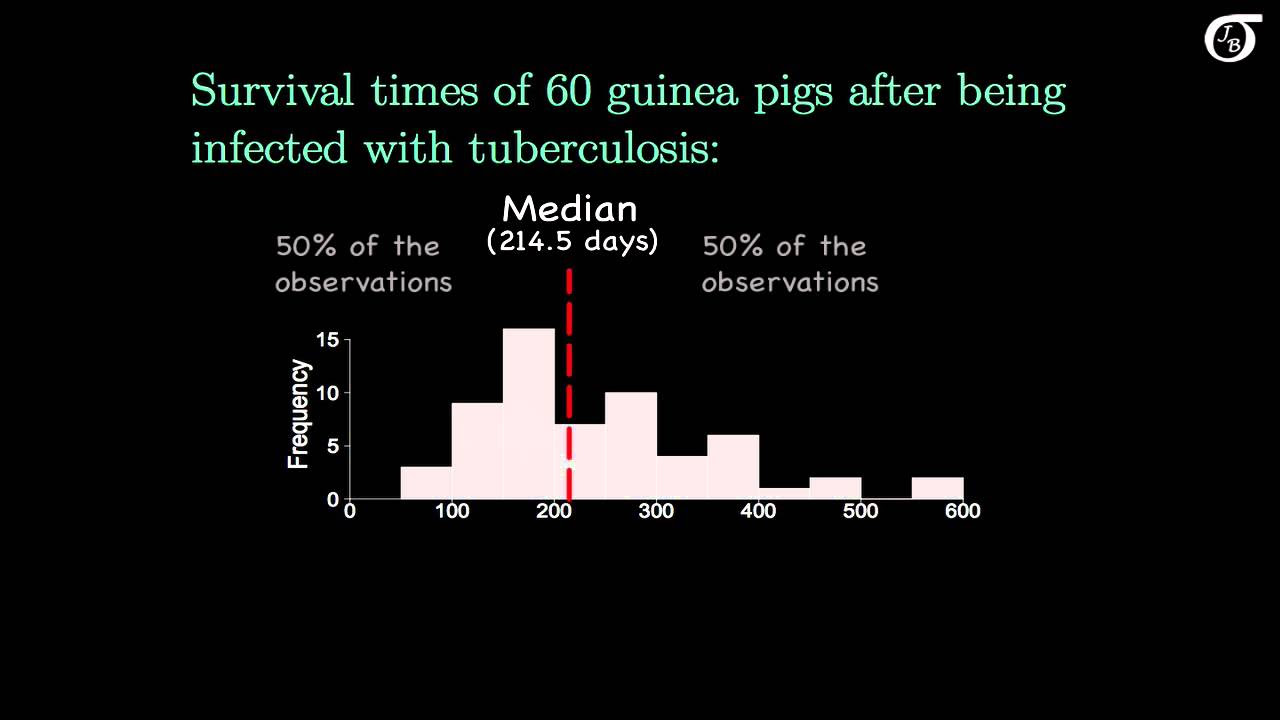
- 🔍 The median is the middle value of an ordered dataset, cutting the data into 50% below and 50% above, and is not sensitive to outliers.
- 🌟 The mode is the most frequently occurring value in a dataset and is a less common measure of central tendency.
- ⚖️ The sample mean is represented with a hat (x-bar or mu-hat) to distinguish it from the population mean (mu), which is often a theoretical value.
- 🎯 The mean is sensitive to outliers and can be influenced by extreme values, pulling the average towards them.
- 🗝️ The trimmed mean is a variation of the mean where a certain percentage of the highest and lowest values are removed before calculating the average.
- 🔄 In a symmetric distribution, the mean and median will be approximately equal, providing similar measures of central tendency.
- 📉 For skewed distributions, the mean is pulled towards the direction of the skewness, making it larger than the median in a right-skewed distribution.
- 📚 Understanding the formulas behind statistical measures provides insight into their function and purpose, rather than just focusing on calculation.
- 🛠️ While software can calculate these measures, grasping the concepts behind them is crucial for statistical analysis and interpretation.
- 📈 Each measure of central tendency has its uses and context; choosing the right one depends on the specific characteristics of the data and the information required.
Q & A
What are the four measures of central tendency discussed in the transcript?
-The four measures of central tendency discussed are the mean (also known as the arithmetic average), trimmed mean, median, and mode.
How is the sample mean calculated?
-The sample mean is calculated by summing all the observations (X1, X2, ..., Xn) and then dividing by the total number of observations (n).
What is the main difference between the mean and the median?
-The mean is sensitive to outliers and tries to find a balance point for the data, while the median is not sensitive to outliers and simply cuts the data in half, with half the observations below and half above it.
What does the transcript mean by saying the mean is a 'balance point'?
-The mean is considered a balance point because it represents the point that would balance all the data points if they were weights on a scale, without tipping to one side or the other.
How is the trimmed mean different from the regular mean?
-The trimmed mean is calculated by removing a certain percentage (like the top and bottom 5%) of the data before computing the mean, making it less sensitive to outliers or extreme values.
What is the mode in the context of the transcript?
-The mode is the value that appears most frequently in a data set. In the transcript's example, the mode is 70, as it is the number that occurs most often.
Why might the median be a better measure than the mean in certain situations?
-The median might be a better measure than the mean when dealing with skewed distributions or when the goal is to understand the typical or central value for individual cases, such as median income, which indicates the income that divides the population into two equal halves.
What does the transcript imply about the relationship between the mean and median in a symmetric distribution?
-In a symmetric distribution, the mean and median will be roughly the same because the mean is not pulled towards any skewness, and both measures effectively represent the center of the data.
How does the transcript differentiate between parametric and nonparametric measures?
-The transcript mentions that the sample mean is a parametric measure, which is used when we assume the data follows a specific distribution. The median, on the other hand, is a nonparametric measure and does not require such an assumption.
What is the significance of the Greek letters in the transcript's discussion of notation?
-In the transcript, Greek letters are used to represent true or population values, while Latin letters are used for sample estimates. The use of a hat on a Greek letter indicates that it is a sample estimate of the population value.
Why is understanding the formulas for mean, median, and mode important even if we can use software to calculate them?
-Understanding the formulas is important because it provides insight into how these measures work and what they represent, allowing for a more informed interpretation of the data and the results produced by software.
Outlines
📊 Introduction to Measures of Central Tendency
This paragraph introduces the concept of measures of central tendency, focusing on the mean (arithmetic average), trimmed mean, median, and mode. It explains the mean as an average that can be sensitive to outliers and serves as a balance point for the data. The paragraph also discusses the use of Latin letters for population values and sample estimates, emphasizing the importance of understanding mathematical notation for statistical analysis. The example of student grades is used to illustrate the calculation of the sample mean.
📈 Understanding the Mean and Median
The paragraph delves deeper into the characteristics of the mean and median. It highlights the mean's sensitivity to outliers and its role as a parametric measure, contrasting it with the median, which is nonparametric and not affected by extreme values. The median is described as the middle value that divides the data into halves. The discussion also touches on the trimmed mean, a variation of the mean that reduces the influence of outliers by removing a certain percentage of the highest and lowest values before calculating the average.
📊 Comparing Mean, Median, and Mode
This section compares the mean, median, and mode, explaining their different uses and interpretations. It describes how the mean and median can differ, especially in skewed distributions, with the mean being pulled towards the skewness. The mode, as the most frequent value, is mentioned as a less commonly used but still relevant measure in certain contexts. The paragraph emphasizes the importance of understanding these measures for accurately representing the center of a data distribution.
Mindmap
Keywords
💡Central Tendency
💡Mean
💡Trimmed Mean
💡Median
💡Mode
💡Outliers
💡Sensitivity to Extreme Values
💡Balance Point
💡Parametric Measure
💡Nonparametric Measure
💡Population Mean
Highlights
The transcript discusses measures of central tendency for a numeric variable, focusing on the mean, trimmed mean, median, and mode.
The mean, also known as the arithmetic average, is introduced as a commonly known measure but with an aim to provide a new perspective.
The transcript explains the mathematical notation for calculating the sample mean, emphasizing the importance of understanding notation for clarity in statistical concepts.
The sensitivity of the mean to outliers is highlighted, noting how extreme values can skew the mean.
A unique analogy is provided, describing the mean as a balance point, attempting to find where the data can be balanced.
The transcript differentiates between parametric and nonparametric measures, with the sample mean being a parametric measure.
The median is introduced as the middle value of ordered observations, dividing the data into halves.
The robustness of the median to outliers is emphasized, contrasting it with the mean's sensitivity.
The concept of trimmed mean is briefly explained, as a way to make the mean less sensitive to outliers by removing extreme values.
The mode is described as the most common value in a data set, noting its less frequent use in statistical analysis.
The transcript discusses the relationship between the mean and median in symmetric and skewed distributions.
The importance of understanding the formulas for mean, median, and mode is stressed, not for calculation but for insight into their functions.
The video aims to provide a deeper understanding of statistical measures rather than focusing on calculation methods.
The transcript concludes by encouraging viewers to stay for more insights into statistical concepts.
Transcripts
Browse More Related Video
Measures of Central Tendency
Mean, Median and Mode - Measures of Central Tendency
Understanding Central Tendency
Mean, Median, Mode, and Outliers: Measures of Central Tendency
Mean, Median, and Mode: Measures of Central Tendency: Crash Course Statistics #3
Statistics: The average | Descriptive statistics | Probability and Statistics | Khan Academy
5.0 / 5 (0 votes)
Thanks for rating: