Understanding Central Tendency
TLDRIn this educational video, Michael Corayer explains the three key measures of central tendency—mean, median, and mode—essential for summarizing and understanding data patterns. He clarifies the difference between population parameters and sample statistics, demonstrating how to calculate each measure with examples. Corayer highlights the mean's sensitivity to outliers, the median's resistance to them, and the mode's representation of the most frequent score. He emphasizes the importance of choosing the right measure based on data distribution and the limitations of each method in analysis.
Takeaways
- 📊 Central tendency measures are used to summarize and understand data patterns, which is essential in statistics as raw data can be too detailed and impractical to analyze in its entirety.
- 🔢 The mean, or arithmetic mean, is calculated by summing all scores and dividing by the number of scores, and is sensitive to changes in individual scores, making it a good indicator of average but susceptible to outliers.
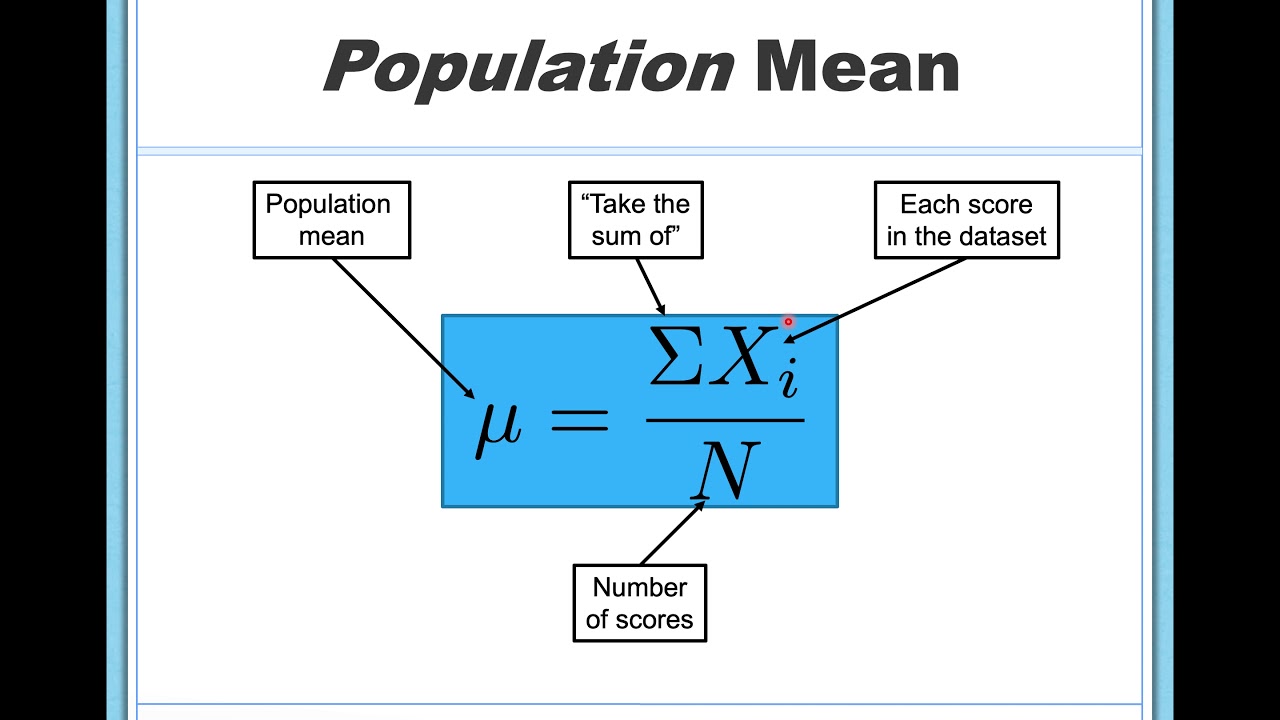
- 📚 The mean is represented by the Greek letter 'mu' for populations and 'M' or 'X-bar' for samples, and understanding the distinction between population parameters and sample statistics is crucial.
- 💡 Researchers often use sample statistics to estimate population parameters when direct access to the entire population is not feasible.
- 📈 The median is the middle score in a dataset and is less sensitive to outliers, making it a better measure of central tendency for skewed distributions.
- 🔄 To find the median, scores are arranged in order, and if there is an odd number of scores, the median is the middle one; with an even number, it's the average of the two middle scores.
- 📉 The mode is the most frequently occurring score in a dataset and is useful for nominal data or when actual scores are needed to represent typical cases.
- 🚫 The mode does not provide information about the spread or frequency distribution of the data, only indicating the most common score.
- 🤔 The choice of which measure of central tendency to use depends on the nature of the data and the distribution of responses, with no single measure being universally best.
- 📘 Understanding the implications of summarizing data is important, as it involves making choices that can affect the interpretation of the data.
- 👍 The video script emphasizes the importance of descriptive statistics in providing a comprehensive understanding of data beyond just measures of central tendency.
Q & A
What are the three measures of central tendency discussed in the video?
-The three measures of central tendency discussed in the video are the mean, median, and mode.
Why is summarizing data important in statistics?
-Summarizing data is important because it makes the data more practical to understand and analyze. Raw data can be highly accurate but overwhelming; summarization helps to extract patterns and improve understanding.
What is the formula for calculating the mean, and how does it differ between a population and a sample?
-The formula for calculating the mean is the sum of all scores divided by the number of scores. For a population, it's represented by the Greek letter mu (μ = Σx / N) and for a sample, it's represented by M or X-bar (X̄ = Σx / n). The calculation method is the same, but the notation differs.
What is the advantage of using the mean as a measure of central tendency?
-The advantage of using the mean is its sensitivity to all scores in the dataset, making it a good representation of the average when extreme scores are evenly distributed.
What are the potential issues with using the mean in a dataset with outliers?
-The mean can be misleading in the presence of outliers, especially in an asymmetrical distribution, as extreme scores can pull the mean in one direction, not accurately representing the center of the data.
How is the median calculated, and what makes it a useful measure in certain datasets?
-The median is calculated by arranging all scores in order and finding the middle score (or the mean of the two middle scores if there's an even number of scores). It's useful in datasets with asymmetrical distributions or outliers, as it's not affected by the magnitude of individual scores.
What is the mode, and how does it differ from the mean and median?
-The mode is the most frequently occurring score in the dataset. Unlike the mean and median, which are computed values, the mode represents actual scores from the data and can be more representative of what's typical.
Why might the mode be a better representation of typical values than the mean or median in certain cases?
-The mode might be a better representation of typical values when dealing with non-numeric data or when the mean and median are influenced by outliers or extreme values, as it reflects the actual scores participants had.
What is the practical example given in the video to illustrate the potential misleading nature of the mean?
-The practical example given is income distribution, where a few individuals with extremely high incomes can skew the mean income to be misleadingly high, not accurately representing the typical income.
How can you type Greek symbols in a word processor according to the video?
-To type Greek symbols in a word processor, the video suggests changing the font to 'Symbol' and then typing the first letter of the Greek name for the symbol using the appropriate case.
What does the video suggest about the best measure of central tendency?
-The video suggests that there is no single best measure of central tendency; it depends on the nature of the data and the distribution of responses. Different measures are suitable for different situations.
Outlines
📊 Introduction to Measures of Central Tendency
Michael Corayer introduces the concept of measures of central tendency, emphasizing the importance of data summarization in statistics. He explains that while raw data is highly accurate, it is impractical, and summarization is necessary for understanding patterns. The mean, or arithmetic mean, is the first measure discussed, with its formula and the distinction between population parameters (mu) and sample statistics (M or X-bar). The video also touches on the sensitivity of the mean to outliers and its potential for misrepresentation in asymmetrical distributions.
🔢 Understanding the Median and Mode
The script continues with an explanation of the median as a measure of central tendency that is less sensitive to outliers and more appropriate for asymmetrical distributions. The process of finding the median, both for odd and even numbers of scores, is outlined. The mode, the most frequently occurring score, is introduced as another measure, with a discussion on unimodal, bimodal, and multimodal distributions, and the unique case of nominal data. The strengths and limitations of the median and mode are compared to the mean, highlighting their insensitivity to outliers and representation of actual participant scores.
📈 Selecting the Appropriate Measure of Central Tendency
In the final paragraph, Corayer discusses the selection of the most suitable measure of central tendency, stating that it depends on the nature of the data and its distribution. He emphasizes that knowing only a measure of central tendency provides limited insight, necessitating additional descriptive statistics for a comprehensive understanding of the data. The video concludes with an invitation to like, subscribe, and explore more psychology tutorials on the channel.
Mindmap
Keywords
💡Measures of central tendency
💡Mean
💡Median
💡Mode
💡Summarizing data
💡Outliers
💡Population vs. Sample
💡Symmetrical distribution
💡Asymmetrical distribution
💡Descriptive statistics
Highlights
Introduction to the concept of measures of central tendency and their importance in data summarization.
Explanation of the need to summarize data for practicality without losing the essence of the data patterns.
The distinction between raw data and summarized data, and the implications of these summaries on understanding data.
Definition and calculation of the mean as a measure of central tendency, including the difference between population and sample means.
The use of Greek letters to represent population parameters and sample statistics in statistical formulas.
A practical example of calculating the mean with a small sample of quiz scores.
Discussion on the sensitivity of the mean to changes in individual scores and its potential influence by outliers.
The concept of the median as an alternative measure of central tendency and its calculation method.
Advantages of the median in cases of asymmetrical distributions and its resistance to outliers.
Explanation of how to find the median in both odd and even numbered datasets.
The mode as the third measure of central tendency, representing the most frequently occurring score.
Examples of unimodal, bimodal, and multimodal distributions, and the concept of a uniform distribution without a mode.
The mode's advantage in representing actual participant scores compared to computed values like the mean and median.
The limitation of the mode in providing information about the frequency difference between scores.
The importance of choosing the appropriate measure of central tendency based on the data distribution and research goals.
The necessity of additional descriptive statistics to fully understand data beyond measures of central tendency.
A call to action for viewers to like, subscribe, and explore more psychology tutorials for further understanding.
Transcripts
Browse More Related Video
Mean, Median and Mode in Statistics | Statistics Tutorial | MarinStatsLectures
Mean, Median, Mode, and Outliers: Measures of Central Tendency
Measures of Central Tendency (Mean, Median, Mode)

Elementary Stats Lesson #3 A
What is Descriptive Statistics ... [Examples and Concept - Mean Median Mode]
What is Central Tendency – An Introduction to Mean, Median, and Mode in Statistics (5-1)
5.0 / 5 (0 votes)
Thanks for rating: