Logistic Regression Details Pt1: Coefficients
TLDRIn this StatQuest video, Josh Starmer delves into logistic regression, focusing on coefficients and their interpretation. He explains how logistic regression uses a continuous variable, like weight, to predict a binary outcome, such as obesity in mice, and contrasts it with linear regression. The video also explores the application of logistic regression to test the relationship between a discrete variable, like a mutated gene, and the outcome. Through the use of the logit function, logistic regression transforms probability into log odds, allowing for the fitting of a straight line and the calculation of coefficients that reflect the relationship between variables. The video concludes by highlighting the similarities between logistic regression and linear models, emphasizing that logistic regression can be used for complex analyses like multiple regression and ANOVA, but with coefficients on a log odds scale.
Takeaways
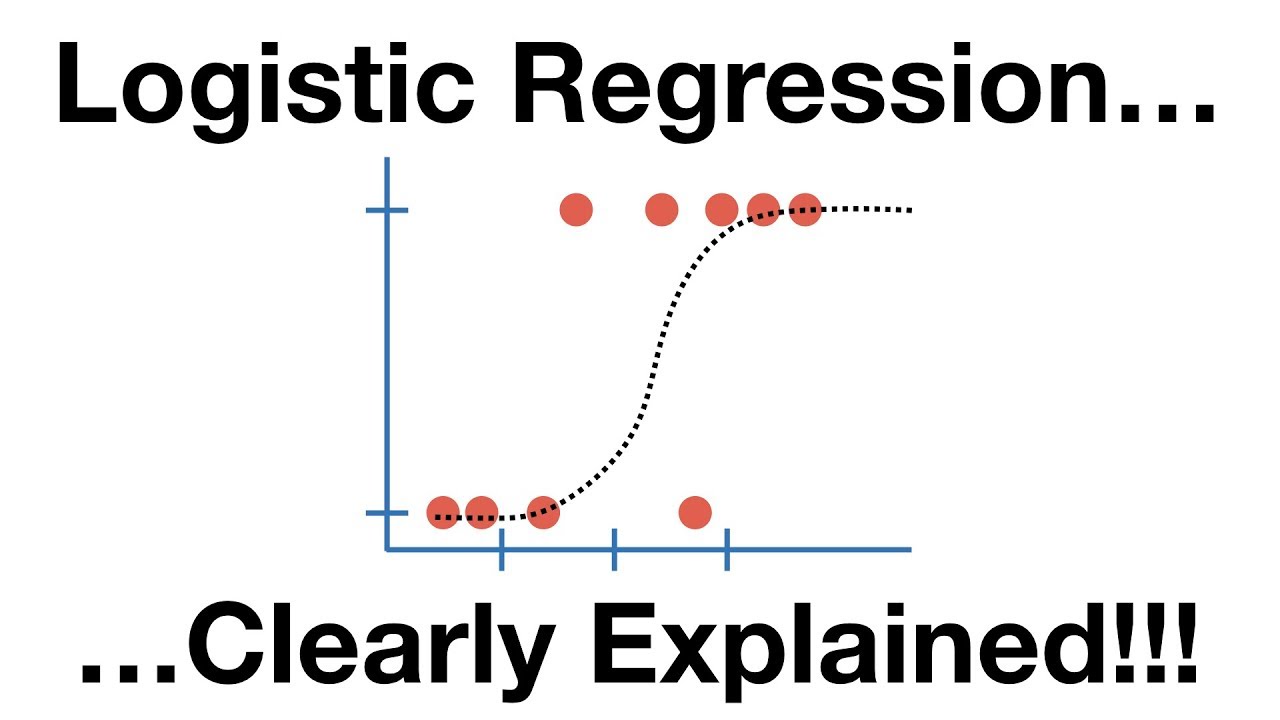
- 📊 Logistic regression is a statistical method used to predict the probability of a binary outcome, such as obesity in the context of the video.
- 🌴 The video is part of a series by Josh Starmer, focusing on explaining logistic regression in detail, starting with coefficients.
- 🔍 Coefficients in logistic regression represent the relationship between the predictor variables and the log odds of the outcome.
- 📈 The logistic regression model transforms the probability scale to a log odds scale, allowing for the use of linear model techniques.
- 🐭 The example used in the video involves predicting the probability of a mouse being obese based on its weight, using a continuous variable.
- 🧬 The video also discusses using logistic regression to test the relationship between a discrete variable, like a mutated gene, and obesity.
- 🤔 The coefficients in logistic regression include an intercept and a slope, similar to linear regression, but are interpreted in the context of log odds.
- 📊 The logistic regression line is determined using maximum likelihood estimation, which finds the best fit for the data within the constraints of the log odds scale.
- 👎 The video notes that with a small sample size, the statistical significance of the coefficients may not be strong, as indicated by large p-values.
- 🔄 The transformation between probability and log odds is done using the logit function, which is crucial for interpreting logistic regression coefficients.
- 📚 The video emphasizes the connection between logistic regression and linear models, suggesting that many concepts from linear models apply to logistic regression as well.
Q & A
What is the main topic of the video?
-The main topic of the video is logistic regression, with a focus on understanding its coefficients and how they are determined and interpreted.
What is the context in which logistic regression is being discussed in the video?
-The context is using logistic regression to predict obesity in mice based on continuous variables like weight and discrete variables like the presence of a mutated gene.
How does logistic regression relate to linear regression?
-Logistic regression is closely related to linear regression as it is a type of generalized linear model (GLM). The concepts and abilities of linear models apply to logistic regression, with the key difference being that logistic regression deals with probabilities and log odds, while linear regression deals with predicting continuous outcomes.
What is the role of the logit function in logistic regression?
-The logit function is used to transform the probability of the outcome (obesity in this case) to log odds, which allows logistic regression to fit a straight line to the data, similar to linear regression.
What does the y-axis represent in a logistic regression graph?
-In a logistic regression graph, the y-axis represents the probability of the outcome (e.g., a mouse being obese), which ranges from 0 to 1. However, through the logit transformation, this is converted to the log odds of the outcome, which can range from negative infinity to positive infinity.
What are the two main coefficients in logistic regression and what do they represent?
-The two main coefficients in logistic regression are the intercept and the slope. The intercept represents the log of the odds of the outcome when the predictor variable is zero. The slope represents how much the log odds of the outcome change for each one-unit increase in the predictor variable.
How is the statistical significance of the coefficients determined in logistic regression?
-The statistical significance of the coefficients is determined using the Z value, which is the estimated coefficient divided by its standard error. If the Z value is more than two standard deviations away from zero, it is considered statistically significant.
What is the purpose of the design matrix in logistic regression?
-The design matrix in logistic regression is used to pair the coefficients with the observed data. It helps in fitting the model to the data by representing the mean values for different levels of the predictor variables and their effects on the outcome.
How does logistic regression handle discrete variables like a mutated gene?
-Logistic regression handles discrete variables by comparing the log odds of the outcome between the different levels of the discrete variable (e.g., presence or absence of a mutated gene). The coefficient for the discrete variable represents the log odds ratio, indicating how much the odds of the outcome change with the presence of the discrete variable.
What is the relationship between logistic regression and t-tests in the context of comparing means?
-Logistic regression can be used similarly to t-tests when comparing means by fitting separate lines to the data for each group and calculating the difference between their means. The coefficients in this case represent the log of the odds ratio, which is analogous to the difference in means in a t-test.
How can the concepts from linear models be applied to logistic regression?
-The concepts from linear models, such as multiple regression and ANOVA, can be applied to logistic regression by recognizing that the coefficients are in terms of log odds rather than raw values. This allows for complex analyses using logistic regression, as long as the interpretation is adjusted to the log odds scale.
Outlines
📚 Introduction to Logistic Regression
This paragraph introduces the topic of logistic regression, explaining it as a method to understand relationships between variables. The speaker, Josh Starmer, sets the stage for a detailed discussion on logistic regression coefficients, emphasizing its connection to linear regression and generalized linear models (GLM). A basic review of logistic regression is provided, using the example of predicting obesity in mice based on their weight, and how the logistic regression model translates weights into probabilities of obesity. The video aims to delve deeper into the interpretation and calculation of coefficients in logistic regression, setting the foundation for the subsequent discussion on coefficients in the context of both continuous and discrete variables.
📈 Transformation of Y-Axis in Logistic Regression
This section focuses on the transformation of the y-axis in logistic regression from probabilities to log odds. The speaker explains how logistic regression deals with the constraint of probabilities ranging between 0 and 1 by using the logit function, which transforms the scale to negative infinity to positive infinity. This transformation allows logistic regression to fit a straight line to the data, similar to linear regression. The coefficients derived from logistic regression are interpreted in the context of the log odds graph, rather than the original probability scale. The paragraph also introduces the concept of the y-axis intercept and slope in the context of logistic regression, providing a mathematical foundation for the upcoming discussion on coefficients.
🧬 Logistic Regression with Discrete Variables
In this paragraph, the discussion shifts to applying logistic regression with discrete variables, using the example of a mouse's gene mutation and its relation to obesity. The speaker compares this type of logistic regression to a t-test done using linear models, highlighting the similarities and differences. The process of fitting two lines to the data, one for mice with a normal gene and another for those with a mutated gene, is explained. The coefficients from logistic regression in this context represent the log of the odds for each gene type and the log of the odds ratio, which indicates how much the presence of a mutated gene affects the odds of obesity. The paragraph emphasizes the statistical significance of these coefficients and how they can be interpreted in the context of logistic regression.
🎯 Summary of Logistic Regression Concepts
The speaker concludes the video with a summary of the key logistic regression concepts covered. It is emphasized that logistic regression shares many similarities with linear models, particularly in terms of coefficients, but operates on a log odds scale. The video has shown how linear model concepts apply to logistic regression, both for regression with continuous variables like weight and for tests with discrete variables like gene mutations. The speaker reiterates that logistic regression allows for the same analytical techniques as linear models, such as multiple regression and ANOVA, with the crucial distinction of working with log odds. The video ends with a call to action for viewers to subscribe for more content and support the channel.
Mindmap
Keywords
💡Logistic Regression
💡Coefficients
💡Continuous Variable
💡Discrete Variable
💡Log Odds
💡Generalized Linear Models (GLM)
💡Logit Function
💡Intercept
💡Slope
💡Standard Error
💡Z Value
Highlights
Logistic regression is introduced as a statistical method for predicting the probability of a certain outcome.
The video series aims to provide a deep dive into the details of logistic regression, starting with coefficients.
Coefficients in logistic regression represent the results and are determined and interpreted within the context of the model.
The video explains the use of logistic regression with continuous variables like weight to predict obesity.
It also discusses the application of logistic regression with discrete variables, such as mutated genes and their relation to obesity.
Logistic regression is a type of generalized linear model (GLM), which extends the concepts of regular linear models.
The y-axis in logistic regression is confined to probability values between 0 and 1, unlike linear regression which can have any number.
The log odds of obesity is used in logistic regression to transform the y-axis, allowing for a straight line representation.
The coefficients in logistic regression are presented in terms of the log odds graph, not the probability graph.
The y-axis intercept in logistic regression represents the log of the odds of obesity when the weight is zero.
The slope coefficient in logistic regression indicates how the log of the odds of obesity changes with each unit increase in weight.
Statistical significance is tested using the Wald's test, which measures the number of standard deviations away from zero.
The video compares logistic regression coefficients to linear model coefficients, highlighting their similarities.
Logistic regression allows for advanced statistical analyses like multiple regression and ANOVA, but with coefficients on a log odds scale.
The video provides a comprehensive understanding of logistic regression, making it accessible for various applications.
The use of logistic regression is demonstrated with a clear example of predicting obesity based on weight and gene mutation.
The video concludes by reinforcing that logistic regression is as versatile as linear models, but with a focus on log odds.
Transcripts
Browse More Related Video

Statistics 101: Logistic Regression, Logit and Regression Equation
StatQuest: Logistic Regression

Regression Analysis | Full Course

Logistic Regression in 3 Minutes

Statistics 101: Multiple Linear Regression, The Very Basics 📈
10.2.1 Regression - Essential Terminology and Background Related to Regression
5.0 / 5 (0 votes)
Thanks for rating: